Fig. 2
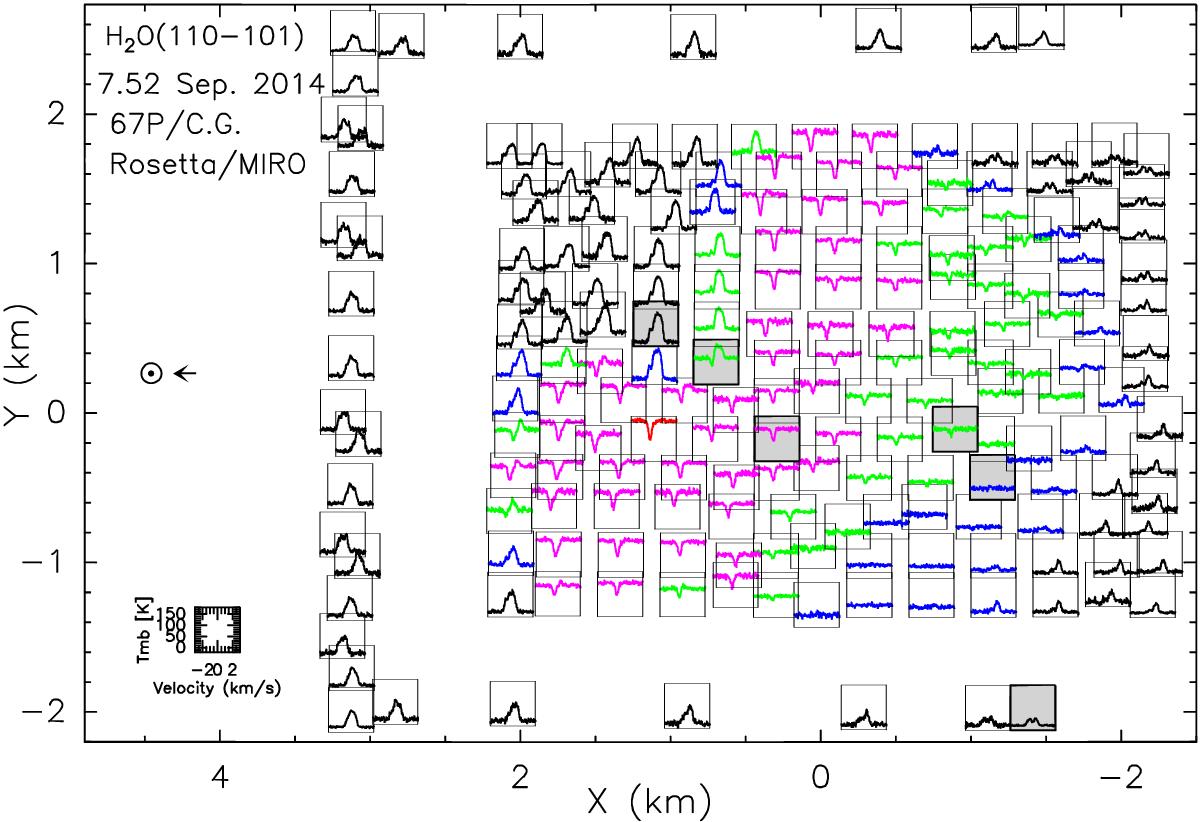
201 spectra of the H![]() O line at 556.936 GHz observed with MIRO between 10h35 and 14h22 UT on 7 September 2014, placed on a map of the sky as seen from the spacecraft with the nucleus center at the origin. Each spectrum corresponds to the average of one to four nearby single spectra (30 to 120 s integrations) obtained with the MIRO CTS in frequency-switching mode. Each small spectrum is plotted at its mean observed position relative to nucleus center, with the submillimeter continuum added as described in the text. The spectra have been also color coded according to the background submillimeter continuum level: black: < 3 K, blue: 3–50 K, green: 50−100 K, pink: 100–150 K, and red >150 K. The six selected spectra of Fig. 4 are highlighted. The scales are the same for all spectra: –20 to +180 K in TmB (vertical axis) and –3 to +3 km s-1 in Doppler velocity relative to the nucleus (horizontal axis). The Sun is to the left, the rotation axis north pole points at a PA of 43° (toward the upper left corner). As discussed in the text (Fig. 4), depending on whether the background is bright or dim relative to the intervening gas, the water line is seen in emission (a peak) or in absorption (a dip), and there are a few intermediate cases.
O line at 556.936 GHz observed with MIRO between 10h35 and 14h22 UT on 7 September 2014, placed on a map of the sky as seen from the spacecraft with the nucleus center at the origin. Each spectrum corresponds to the average of one to four nearby single spectra (30 to 120 s integrations) obtained with the MIRO CTS in frequency-switching mode. Each small spectrum is plotted at its mean observed position relative to nucleus center, with the submillimeter continuum added as described in the text. The spectra have been also color coded according to the background submillimeter continuum level: black: < 3 K, blue: 3–50 K, green: 50−100 K, pink: 100–150 K, and red >150 K. The six selected spectra of Fig. 4 are highlighted. The scales are the same for all spectra: –20 to +180 K in TmB (vertical axis) and –3 to +3 km s-1 in Doppler velocity relative to the nucleus (horizontal axis). The Sun is to the left, the rotation axis north pole points at a PA of 43° (toward the upper left corner). As discussed in the text (Fig. 4), depending on whether the background is bright or dim relative to the intervening gas, the water line is seen in emission (a peak) or in absorption (a dip), and there are a few intermediate cases.
Current usage metrics show cumulative count of Article Views (full-text article views including HTML views, PDF and ePub downloads, according to the available data) and Abstracts Views on Vision4Press platform.
Data correspond to usage on the plateform after 2015. The current usage metrics is available 48-96 hours after online publication and is updated daily on week days.
Initial download of the metrics may take a while.