Fig. 1
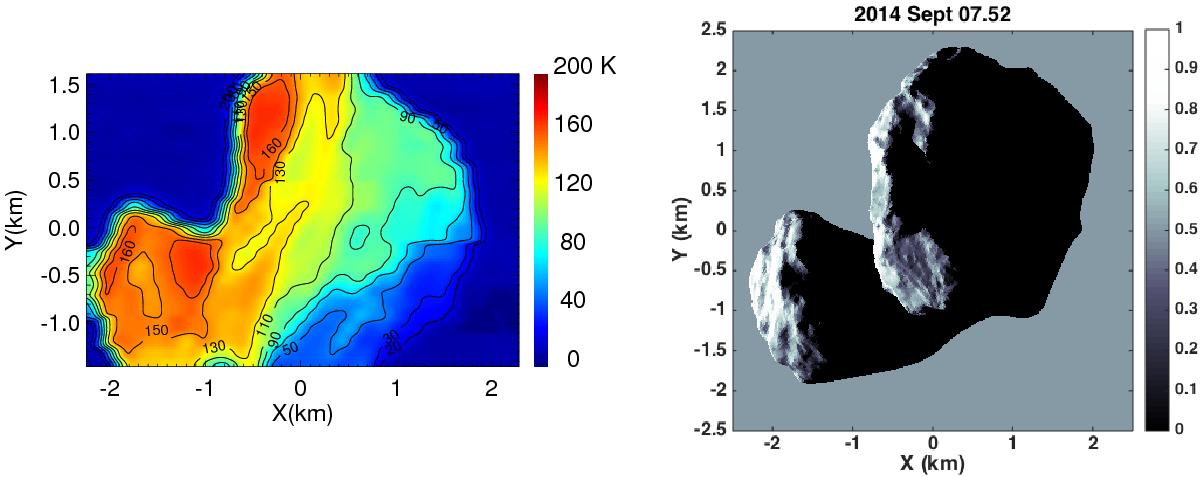
Left: context submillimeter continuum of the nucleus of 67P mapped at the same time as the H![]() O and H
O and H![]() O lines (Figs. 2 and 3). In all maps X and Y refer to the spacecraft coordinates axes, the X-axis pointing in the direction of the Sun; the nucleus center of comet 67P is at the origin of the direction. Intensity contours in brightness temperatures (but assuming ηfss = 1.0) are drawn and the color scale is given on the right. Nucleus brightness temperatures vary from ≈30 K in regions of polar night (lower right, Choukroun et al. 2015) to >160 K in the warmest regions (left side). As a result of its rapid rotation, the nucleus has been smeared during the three hours of mapping. Right: illumination map of the nucleus of 67P as seen from Rosetta at the central time of the observation (12h30 UT). Map based on the Shape 5 model of 67P (Jorda et al. 2015).
O lines (Figs. 2 and 3). In all maps X and Y refer to the spacecraft coordinates axes, the X-axis pointing in the direction of the Sun; the nucleus center of comet 67P is at the origin of the direction. Intensity contours in brightness temperatures (but assuming ηfss = 1.0) are drawn and the color scale is given on the right. Nucleus brightness temperatures vary from ≈30 K in regions of polar night (lower right, Choukroun et al. 2015) to >160 K in the warmest regions (left side). As a result of its rapid rotation, the nucleus has been smeared during the three hours of mapping. Right: illumination map of the nucleus of 67P as seen from Rosetta at the central time of the observation (12h30 UT). Map based on the Shape 5 model of 67P (Jorda et al. 2015).
Current usage metrics show cumulative count of Article Views (full-text article views including HTML views, PDF and ePub downloads, according to the available data) and Abstracts Views on Vision4Press platform.
Data correspond to usage on the plateform after 2015. The current usage metrics is available 48-96 hours after online publication and is updated daily on week days.
Initial download of the metrics may take a while.