Fig. 2
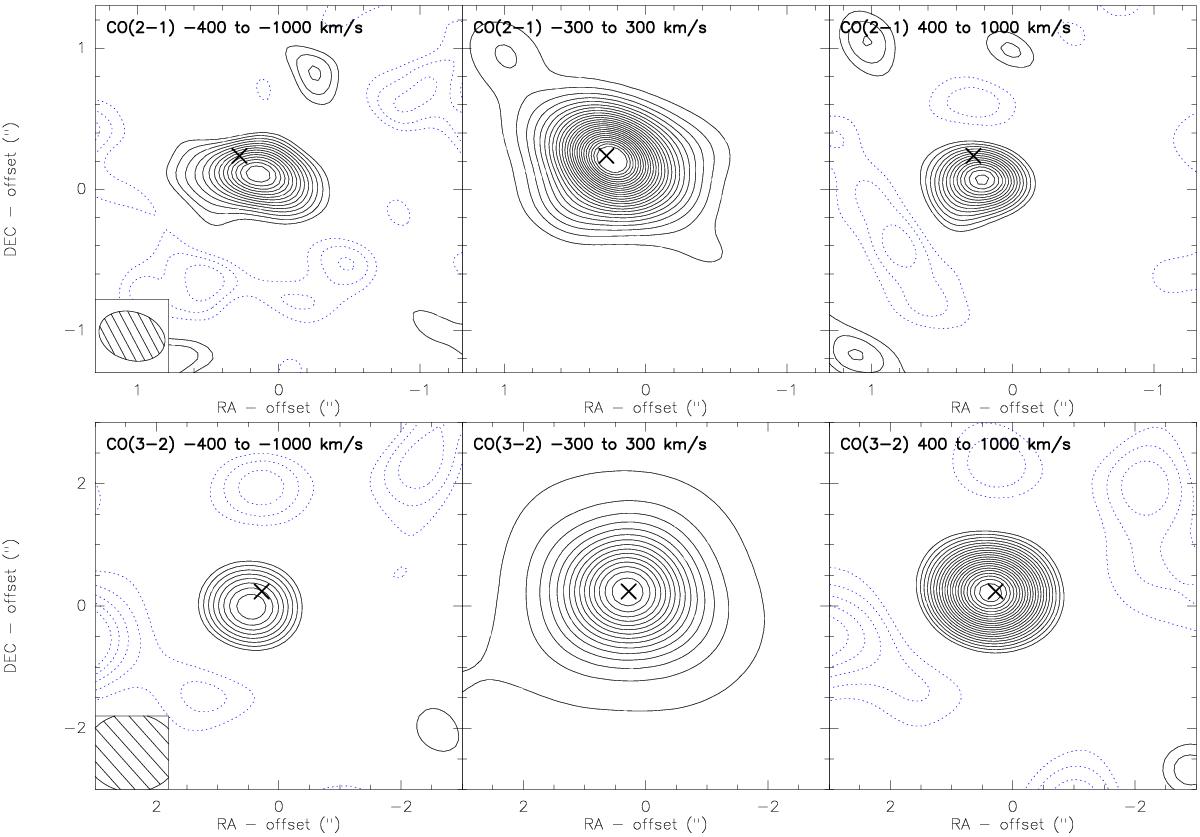
Channel maps of CO(2−1) (DS1, upper panels) and CO(3−2) (lower panels) in three different velocity ranges (indicated by the labels). The contours start from 4σ and are in steps of 1σ for the blue and red wing maps (right and left panels for both CO transitions, respectively). Negative contours are shown by dotted lines, and are in steps of 1σ, starting at −1σ. In the systemic component map (middle panels), contours are in steps of 10σ starting from 10σ, for the sake of clarity. The synthesized beams are shown by hatched areas for each data set. 1σ = 0.14 Jy km s-1 for CO(2−1), = 0.72 Jy km s-1 for CO(3−2). The cross marks the position of the 1.4 GHz continuum as measured by the VLBI, α = 12:56:14.2339, δ = 56:52:25.237 (J2000, Ma et al. 1998).
Current usage metrics show cumulative count of Article Views (full-text article views including HTML views, PDF and ePub downloads, according to the available data) and Abstracts Views on Vision4Press platform.
Data correspond to usage on the plateform after 2015. The current usage metrics is available 48-96 hours after online publication and is updated daily on week days.
Initial download of the metrics may take a while.