Fig. 14
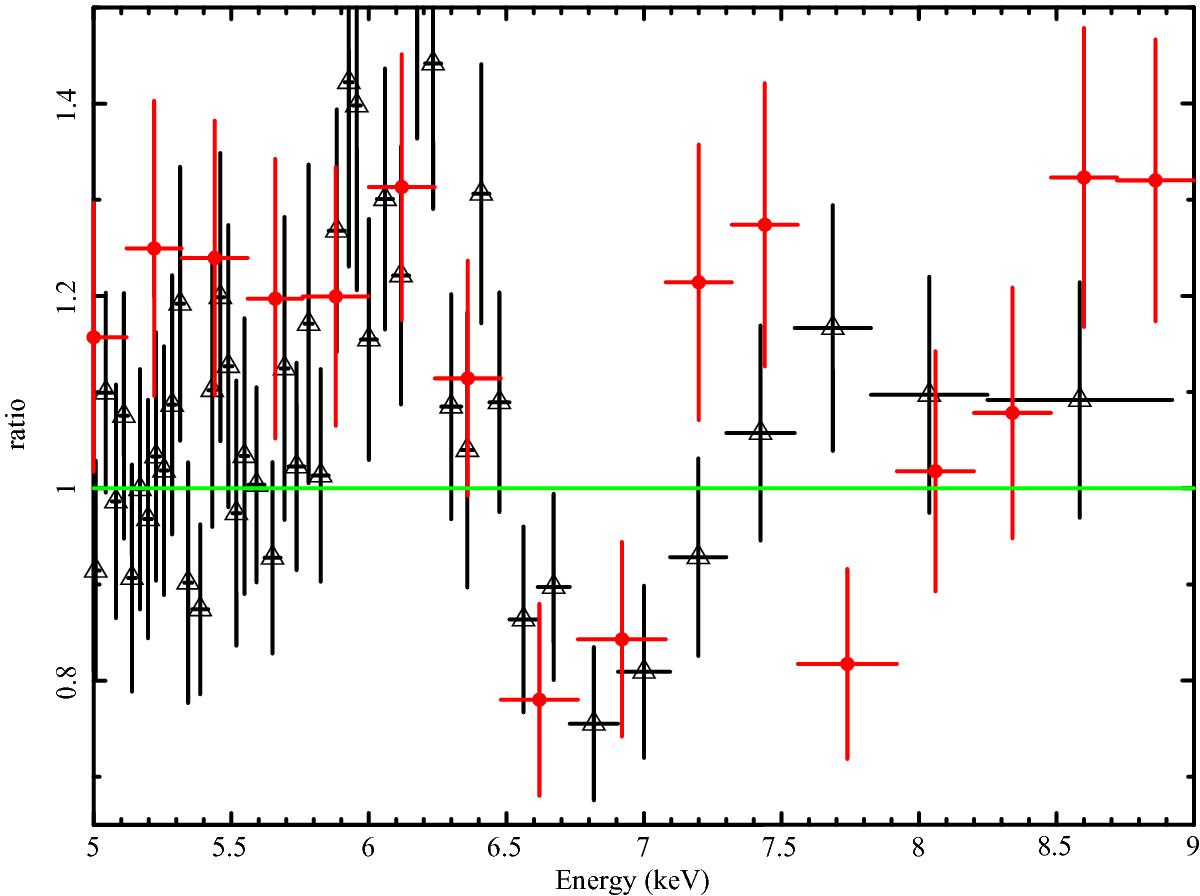
The ratio between data the best model including two thermal components, a power law component and a narrow Gaussian emission line at 6.18 keV (6.44 keV rest frame, iron Kα). Black triangles = Chandra data; red dots = NuSTAR data. A strong excess around 6 keV and a deficit of counts around 7 keV are seen. Note that the NuSTAR data, even taking into account the lower spectral resolution, follow the Chandra data.
Current usage metrics show cumulative count of Article Views (full-text article views including HTML views, PDF and ePub downloads, according to the available data) and Abstracts Views on Vision4Press platform.
Data correspond to usage on the plateform after 2015. The current usage metrics is available 48-96 hours after online publication and is updated daily on week days.
Initial download of the metrics may take a while.