Free Access
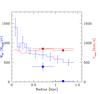
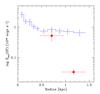
Fig. 13
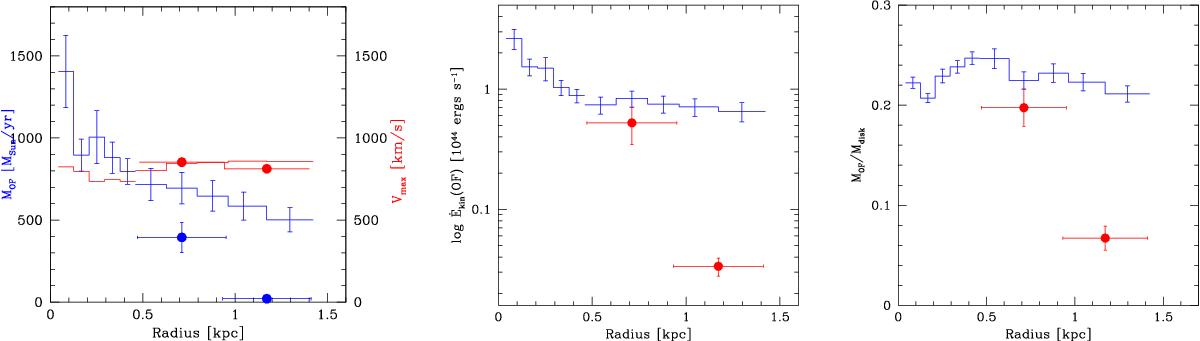
Left panel: integral radial profiles (histogram) and profiles in annuli (points) of the outflow rate ![]() (left axis), and vmax (right axis). Middle panel: radial profile of
(left axis), and vmax (right axis). Middle panel: radial profile of ![]() . Right panel: radial profile of the outflow/molecular disk mass, MOF/Mdisk.
. Right panel: radial profile of the outflow/molecular disk mass, MOF/Mdisk.
This figure is made of several images, please see below:
Current usage metrics show cumulative count of Article Views (full-text article views including HTML views, PDF and ePub downloads, according to the available data) and Abstracts Views on Vision4Press platform.
Data correspond to usage on the plateform after 2015. The current usage metrics is available 48-96 hours after online publication and is updated daily on week days.
Initial download of the metrics may take a while.