Free Access
Fig. 6
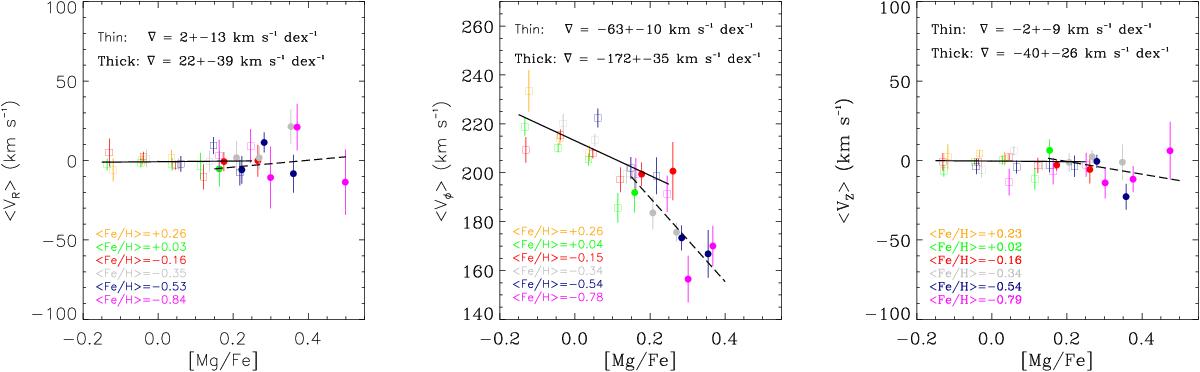
Average radial, azimuthal, and vertical velocity (⟨ VR ⟩, ⟨ Vφ ⟩ , and ⟨ VZ ⟩) as a function of the [Mg/Fe] ratio. The [Fe/H] curves are colour-coded, and the average values of each one are written in the legend. The symbols, errors bars, and linear fit are the same as in Fig. 5.
Current usage metrics show cumulative count of Article Views (full-text article views including HTML views, PDF and ePub downloads, according to the available data) and Abstracts Views on Vision4Press platform.
Data correspond to usage on the plateform after 2015. The current usage metrics is available 48-96 hours after online publication and is updated daily on week days.
Initial download of the metrics may take a while.