Fig. 5
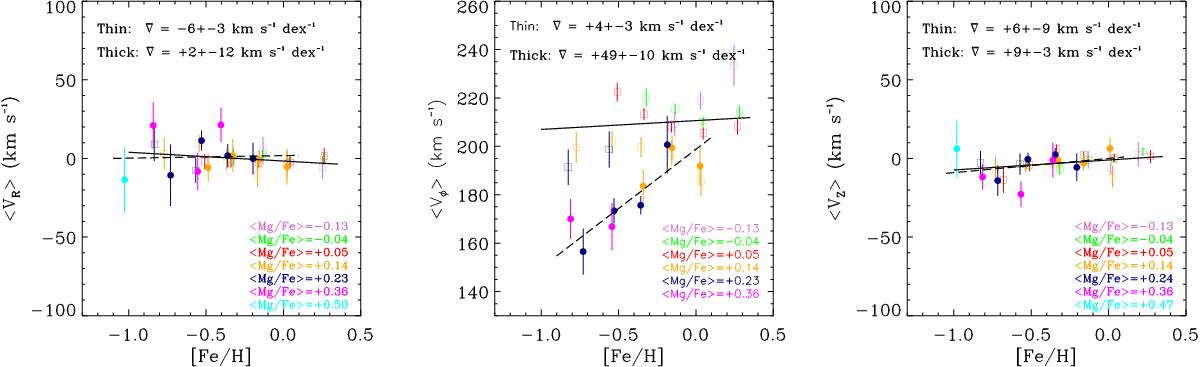
Average radial, azimuthal, and vertical velocity (⟨ VR ⟩, ⟨ Vφ ⟩ , and ⟨ VZ ⟩) as a function of the [Fe/H] ratio. The [Mg/Fe] bins are colour-coded, and the average values of each one are written in the legend. The thin and thick discs are represented by open squares (□) and filled circles (•), respectively. The error bars correspond to the standard errors on the mean velocity for each bin. The derived thin- and thick-disc gradients are shown as full and dashed lines, respectively.
Current usage metrics show cumulative count of Article Views (full-text article views including HTML views, PDF and ePub downloads, according to the available data) and Abstracts Views on Vision4Press platform.
Data correspond to usage on the plateform after 2015. The current usage metrics is available 48-96 hours after online publication and is updated daily on week days.
Initial download of the metrics may take a while.