Fig. 11
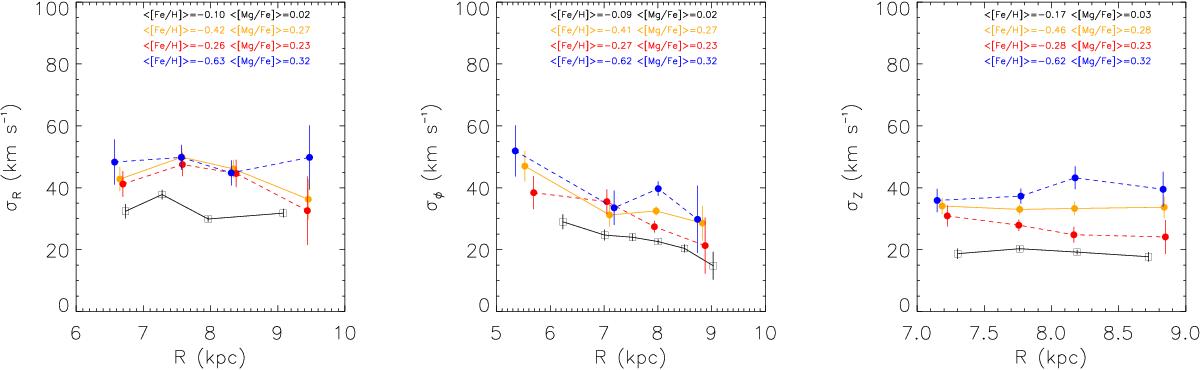
Radial, azimuthal, and vertical velocity dispersion (σR, σφ , and σZ) as a function of the Galactocentric radius R. The thin and the thick discs are represented by open squares and filled circles, respectively. The full orange line corresponds to the whole thick disc, while the red and blue dashed lines represent its decomposition into two sub-samples (Fe-rich and Fe-poor). The error bars correspond to the standard deviation of 1000 bootstrapping realisations. The average [Fe/H] and [Mg/Fe] values of each population for the whole R range are marked.
Current usage metrics show cumulative count of Article Views (full-text article views including HTML views, PDF and ePub downloads, according to the available data) and Abstracts Views on Vision4Press platform.
Data correspond to usage on the plateform after 2015. The current usage metrics is available 48-96 hours after online publication and is updated daily on week days.
Initial download of the metrics may take a while.