Fig. A.5
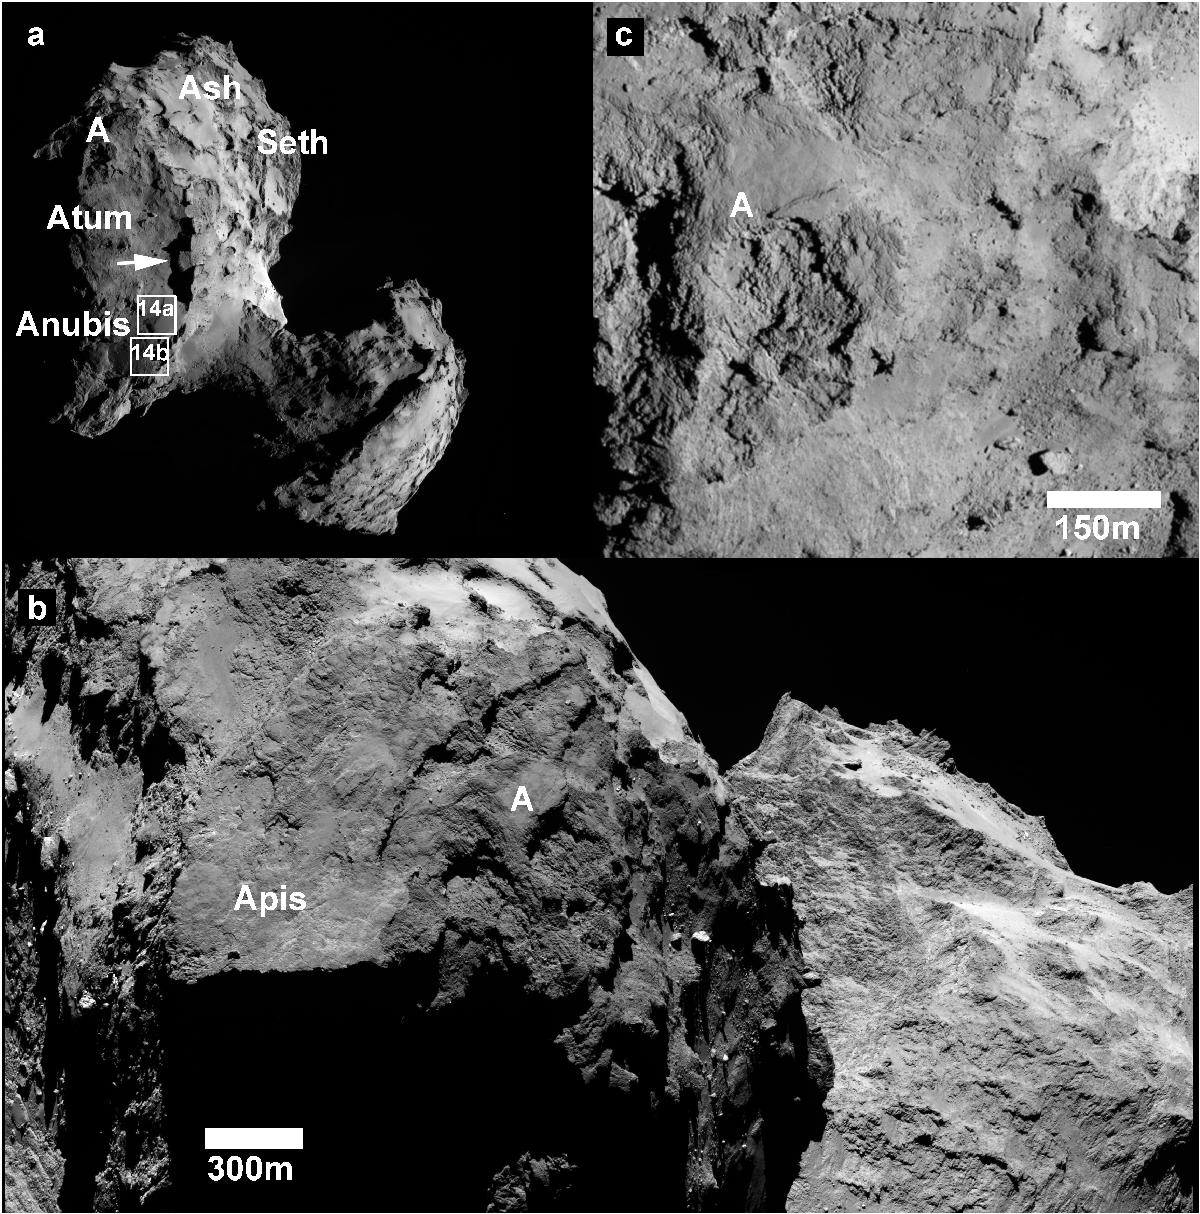
a) WAC image showing the side of the comet with Atum and Anubis regions on the body lobe. “A” marks the location of a complex depression that is highlighted in b) and c) as well. Boxes show the locations of Figs. A.7a and b while the white arrow shows the ridge separating Seth and Anubis, which is further highlighted in Fig. A.7c. b) NAC mosaic of two images showing an oblique view of the Atum region, its contact with Apis, and feature “A”. Note the rough and pitted texture, and limited number of boulders. An anaglyph version of this figure is available in Fig.A.6. c) Cropped NAC image showing part of the Atum region concentrating on feature “A”.
Current usage metrics show cumulative count of Article Views (full-text article views including HTML views, PDF and ePub downloads, according to the available data) and Abstracts Views on Vision4Press platform.
Data correspond to usage on the plateform after 2015. The current usage metrics is available 48-96 hours after online publication and is updated daily on week days.
Initial download of the metrics may take a while.