Fig. 9
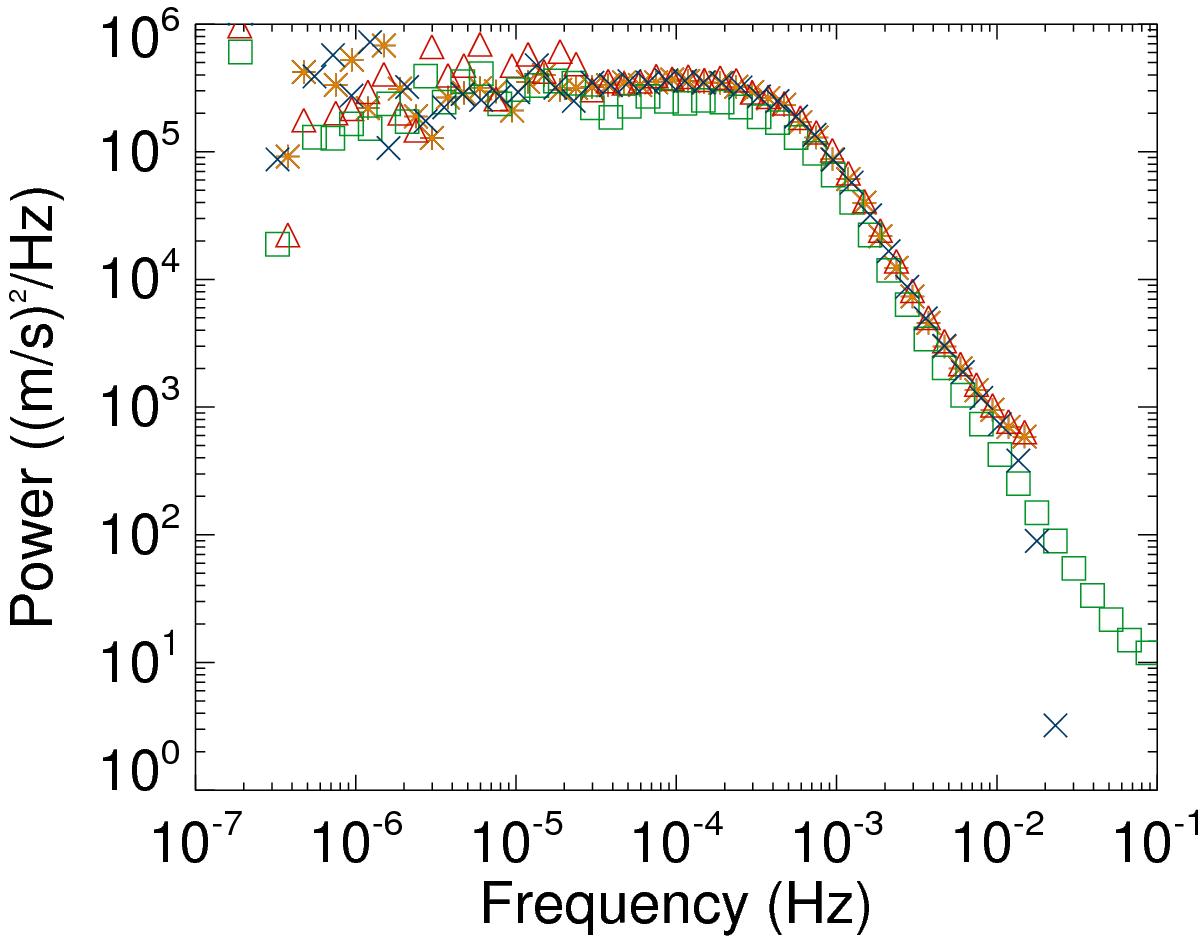
Smoothed power spectra for several small field-of-view time series (disk center): simulation made with a 30-s time step for 200 000 steps (orange stars), the same simulation extrapolated every 5 s (blue crosses), simulation made with a 5-s time step for 1 200 000 steps (green squares), and extraction of 1 point every 6 points of this time series (red triangles).
Current usage metrics show cumulative count of Article Views (full-text article views including HTML views, PDF and ePub downloads, according to the available data) and Abstracts Views on Vision4Press platform.
Data correspond to usage on the plateform after 2015. The current usage metrics is available 48-96 hours after online publication and is updated daily on week days.
Initial download of the metrics may take a while.