Free Access
Fig. 5
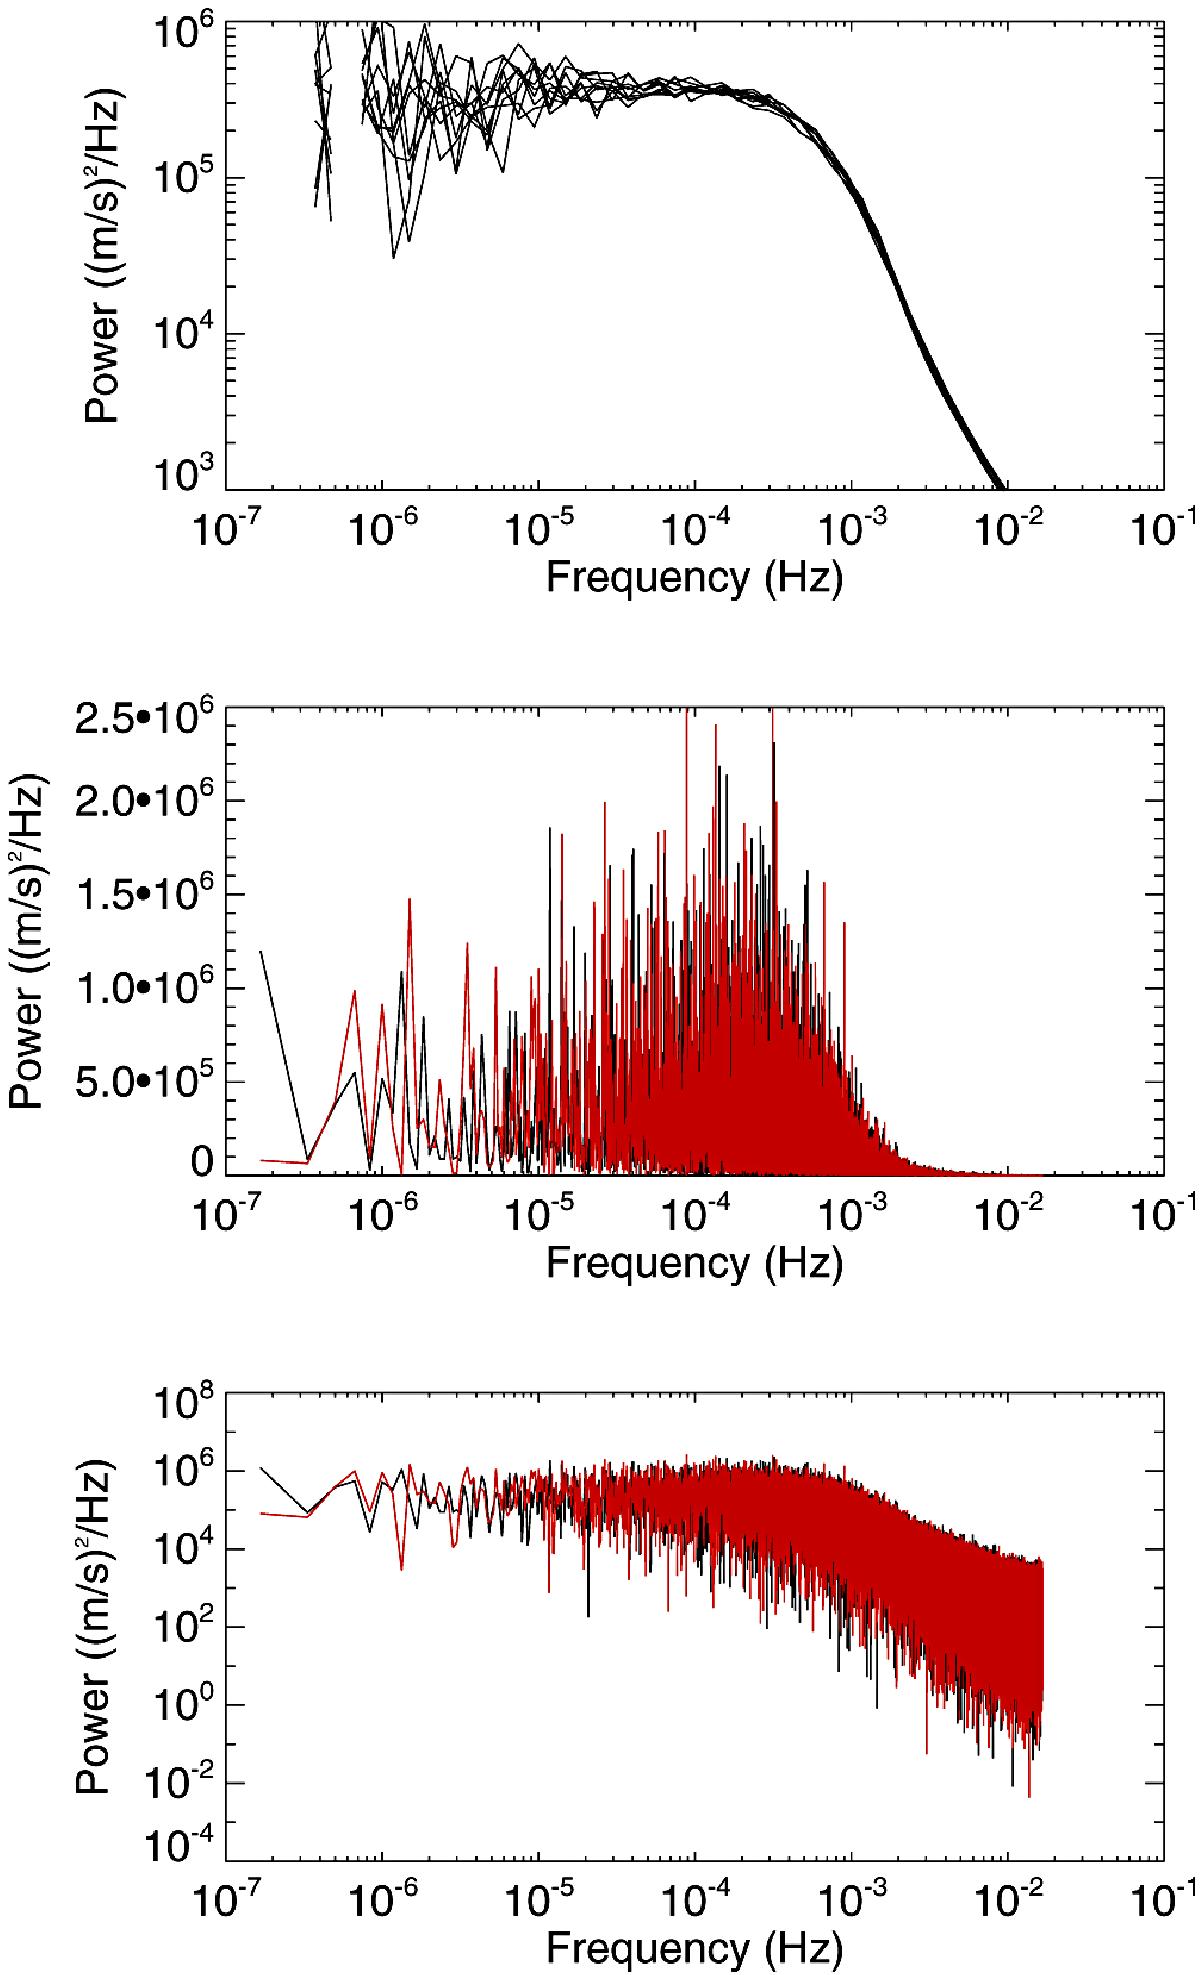
Upper panel: smoothed power spectra (on a log scale) for ten realizations of the small field of view at disk center. Middle panel: original power spectrum (on a linear scale) for two of these realizations. Lower panel: same on a logarithmic scale.
Current usage metrics show cumulative count of Article Views (full-text article views including HTML views, PDF and ePub downloads, according to the available data) and Abstracts Views on Vision4Press platform.
Data correspond to usage on the plateform after 2015. The current usage metrics is available 48-96 hours after online publication and is updated daily on week days.
Initial download of the metrics may take a while.