Fig. 22
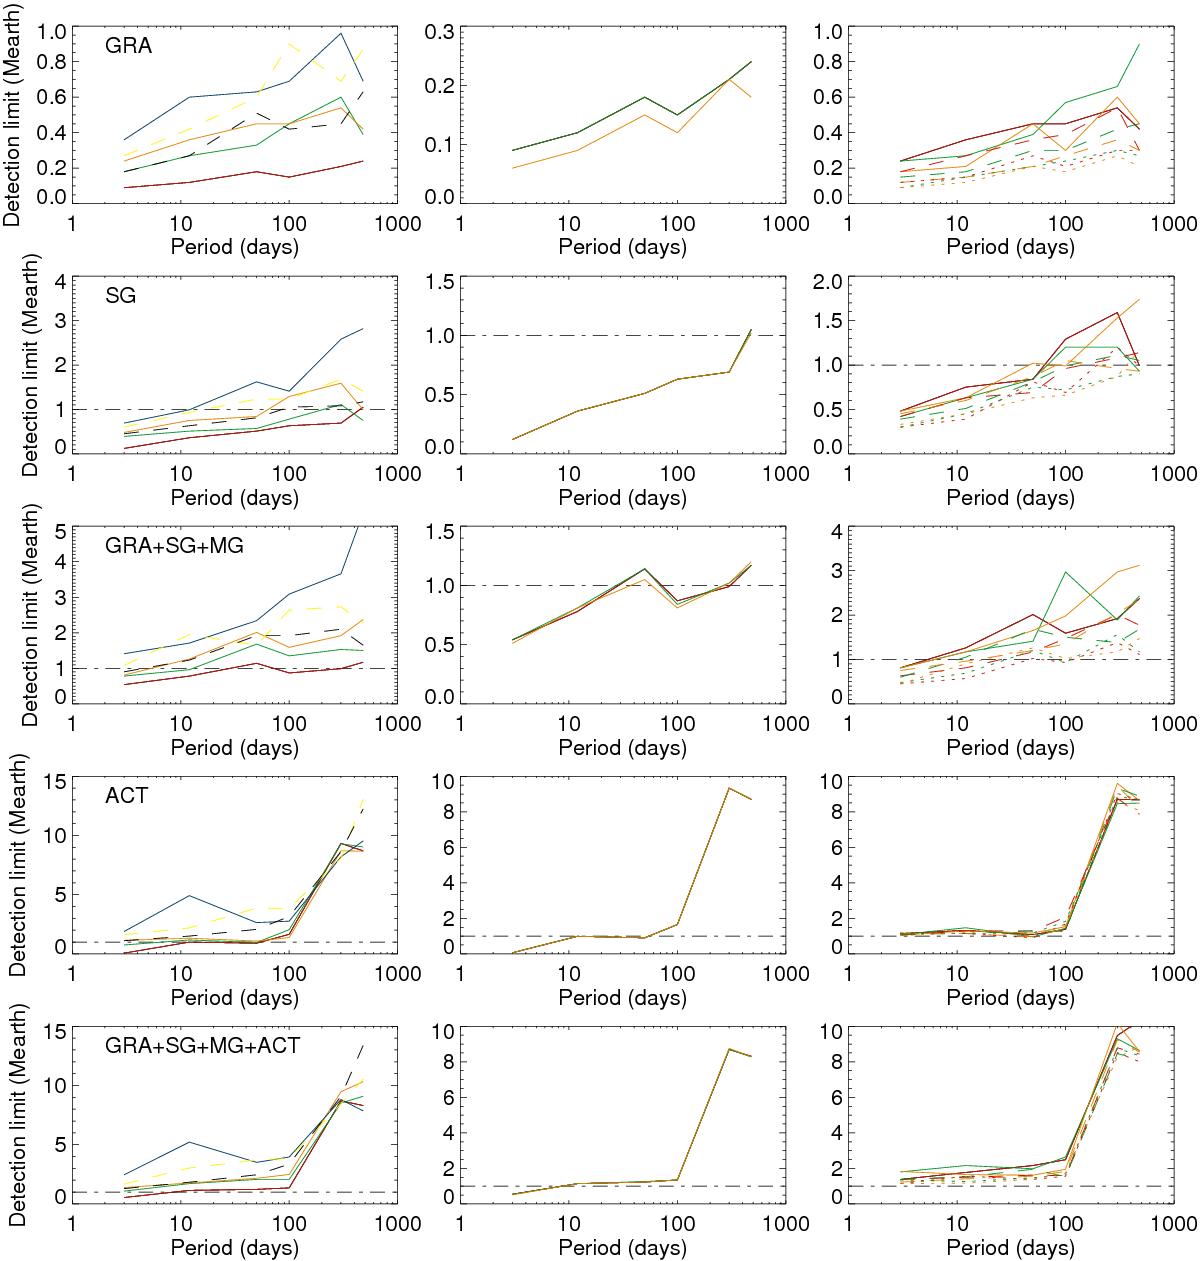
First row: detection limits for granulation. The left panel shows the detection limit versus the planet period for a 30 min observing duration over 1 night, for different samplings: 1 day (red), 4 days (green), 8 days (orange), 20 day (blue), random sampling of 20 days per year (dashed yellow), random sampling of 40 days per year (dashed black). The middle panel shows the detection limit for the 1 day sampling over one night for different observing durations: 30 min (red), 1 h (green), 2 h (orange). The right panel shows the detection limit for the 8 day sampling over one night for different observing durations (same colors as middle panel) and nights: 1 night (solid lines), 2 nights (dashed lines), 5 nights (dotted lines). In all cases the horizontal dotted-dashed line shows the 1 MEarth level. Second row: same for supergranulation (at a level 2.5 times the minimum). Third row: same for granulation + supergranulation + mesogranulation. Fourth row: same for magnetic activity. Fifth row: same for the four components.
Current usage metrics show cumulative count of Article Views (full-text article views including HTML views, PDF and ePub downloads, according to the available data) and Abstracts Views on Vision4Press platform.
Data correspond to usage on the plateform after 2015. The current usage metrics is available 48-96 hours after online publication and is updated daily on week days.
Initial download of the metrics may take a while.