Fig. 15
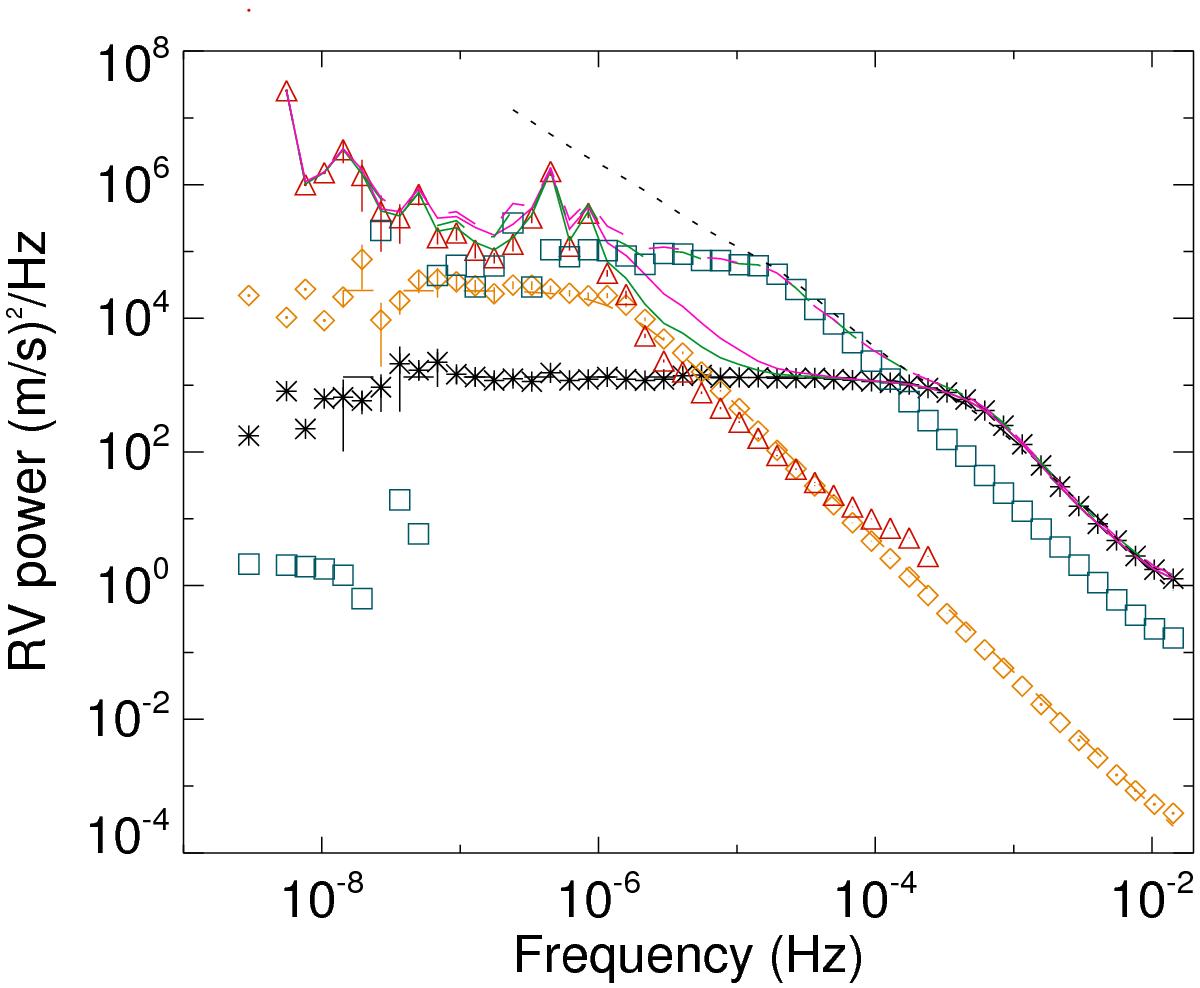
Smoothed power spectrum of the RV granulation time series, for the full hemisphere and 30-s time steps (black stars), fitted by the Harvey function (black solid line). The power spectrum for supergranulation (minimum values) is shown with orange diamonds, the activity signal with red triangles, and mesogranulaion derived from supergranulation scaled to the Palle et al. (1995) parameters with blue squares. The green solid line corresponds to the sum of the three contributions (granulation, minimum supergranulation, activity) and the pink solid line is the same, but includes the maximum supergranulation. The green and pink dashed lines include mesogranulation. The black dotted line indicates the level fitted by Palle et al. (1995). The activity signal is cut above 30 min due to our time step.
Current usage metrics show cumulative count of Article Views (full-text article views including HTML views, PDF and ePub downloads, according to the available data) and Abstracts Views on Vision4Press platform.
Data correspond to usage on the plateform after 2015. The current usage metrics is available 48-96 hours after online publication and is updated daily on week days.
Initial download of the metrics may take a while.