Fig. 13
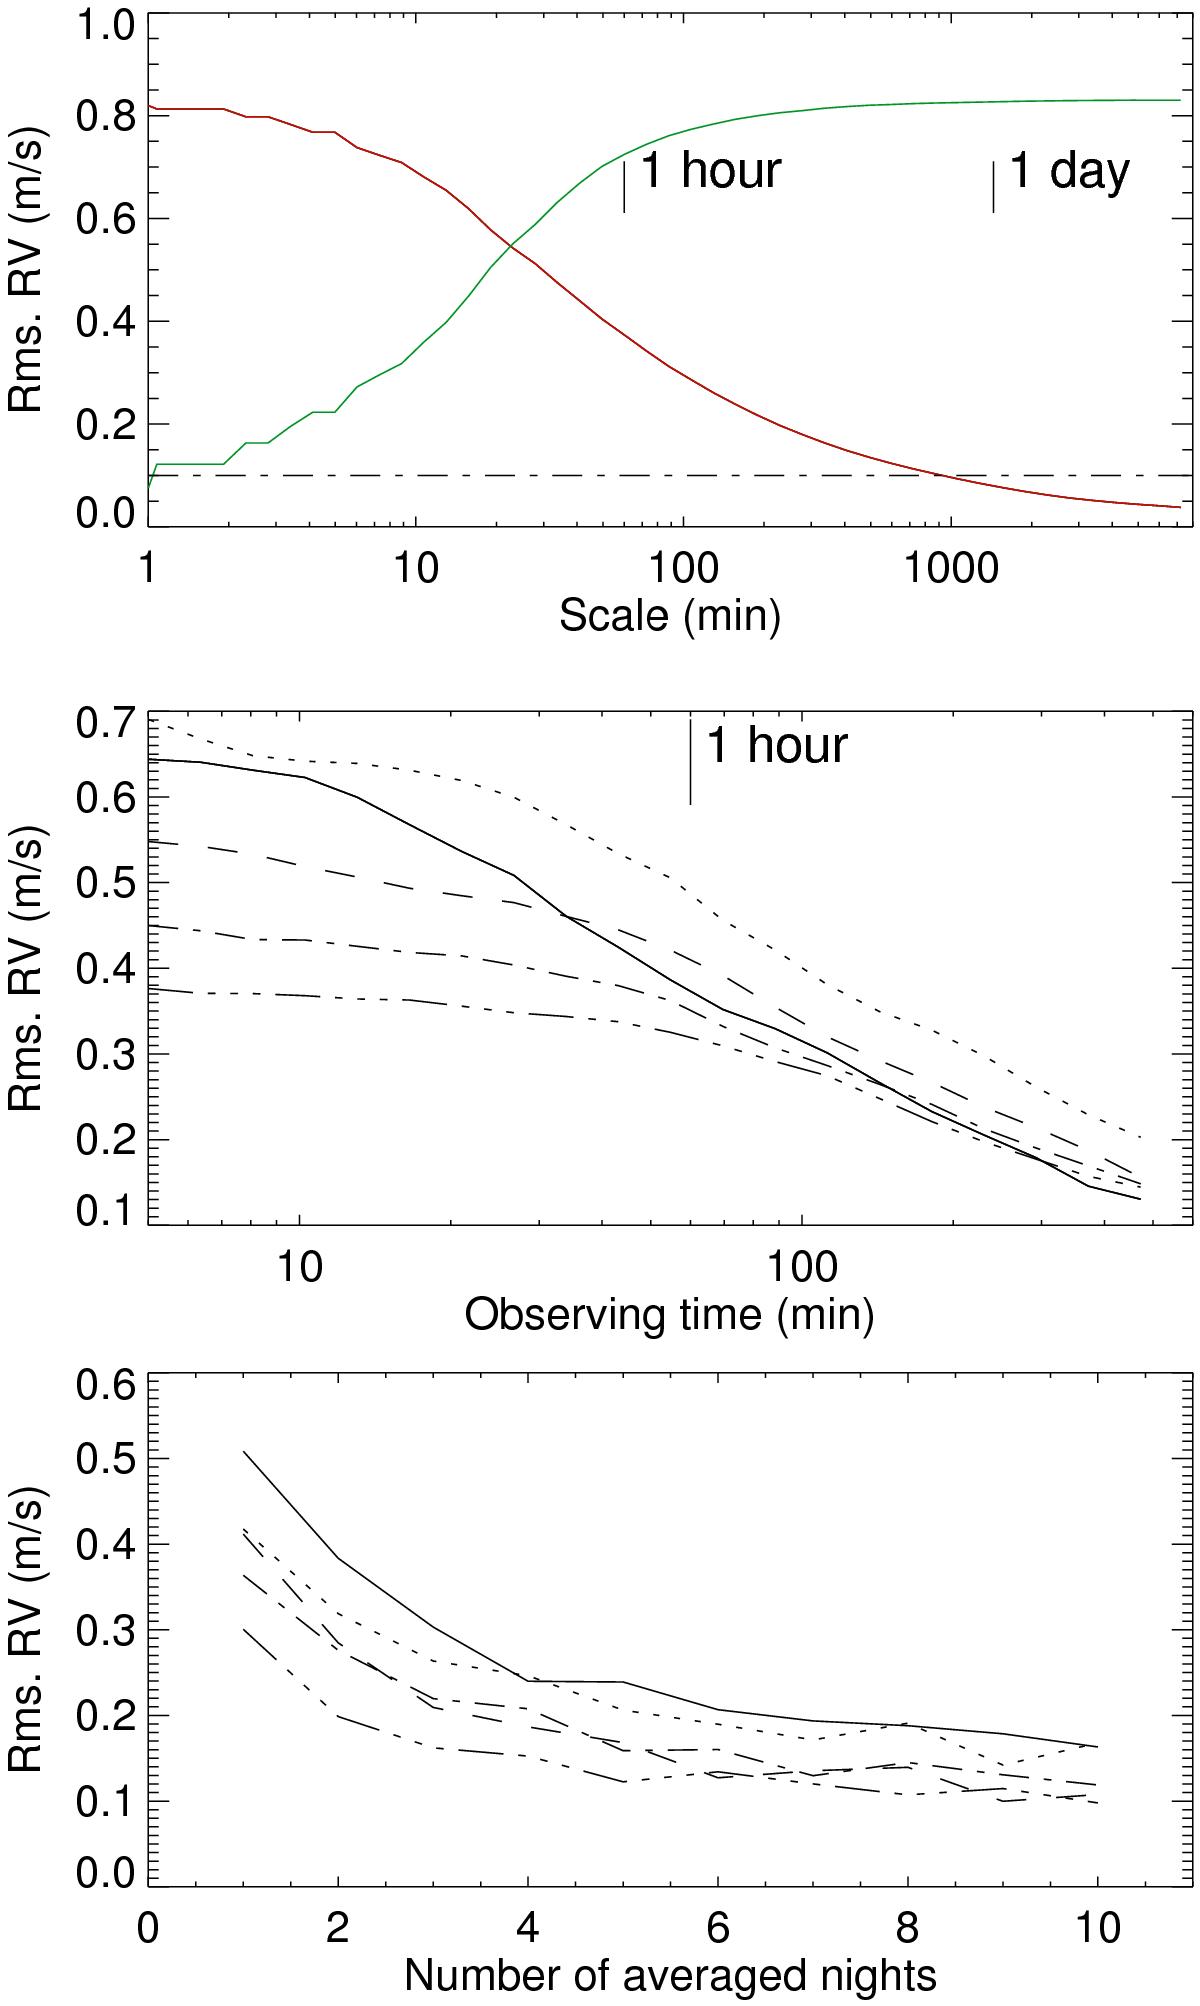
Upper panel: rms of the smoothed granulation RV time series (red curve) versus scale. The rms RV of the corresponding residuals are in green. The horizontal dot-dashed line indicates a typical level of the noise induced by future instruments. Middle panel: rms RV of the granulation versus observing time during one night for a different number of observing periods n during each night (1: solid line; 2: dotted line; 3: dashed line; 4: dot-dashed line; 5: dot-dot-dot-dashed line). The exposure time is the observing time divided by n. Lower panel: same for the rms RV of the granulation versus the number of nights over which the signal is averaged, in the case of a 26-min observing time per night.
Current usage metrics show cumulative count of Article Views (full-text article views including HTML views, PDF and ePub downloads, according to the available data) and Abstracts Views on Vision4Press platform.
Data correspond to usage on the plateform after 2015. The current usage metrics is available 48-96 hours after online publication and is updated daily on week days.
Initial download of the metrics may take a while.