Free Access
Fig. 10
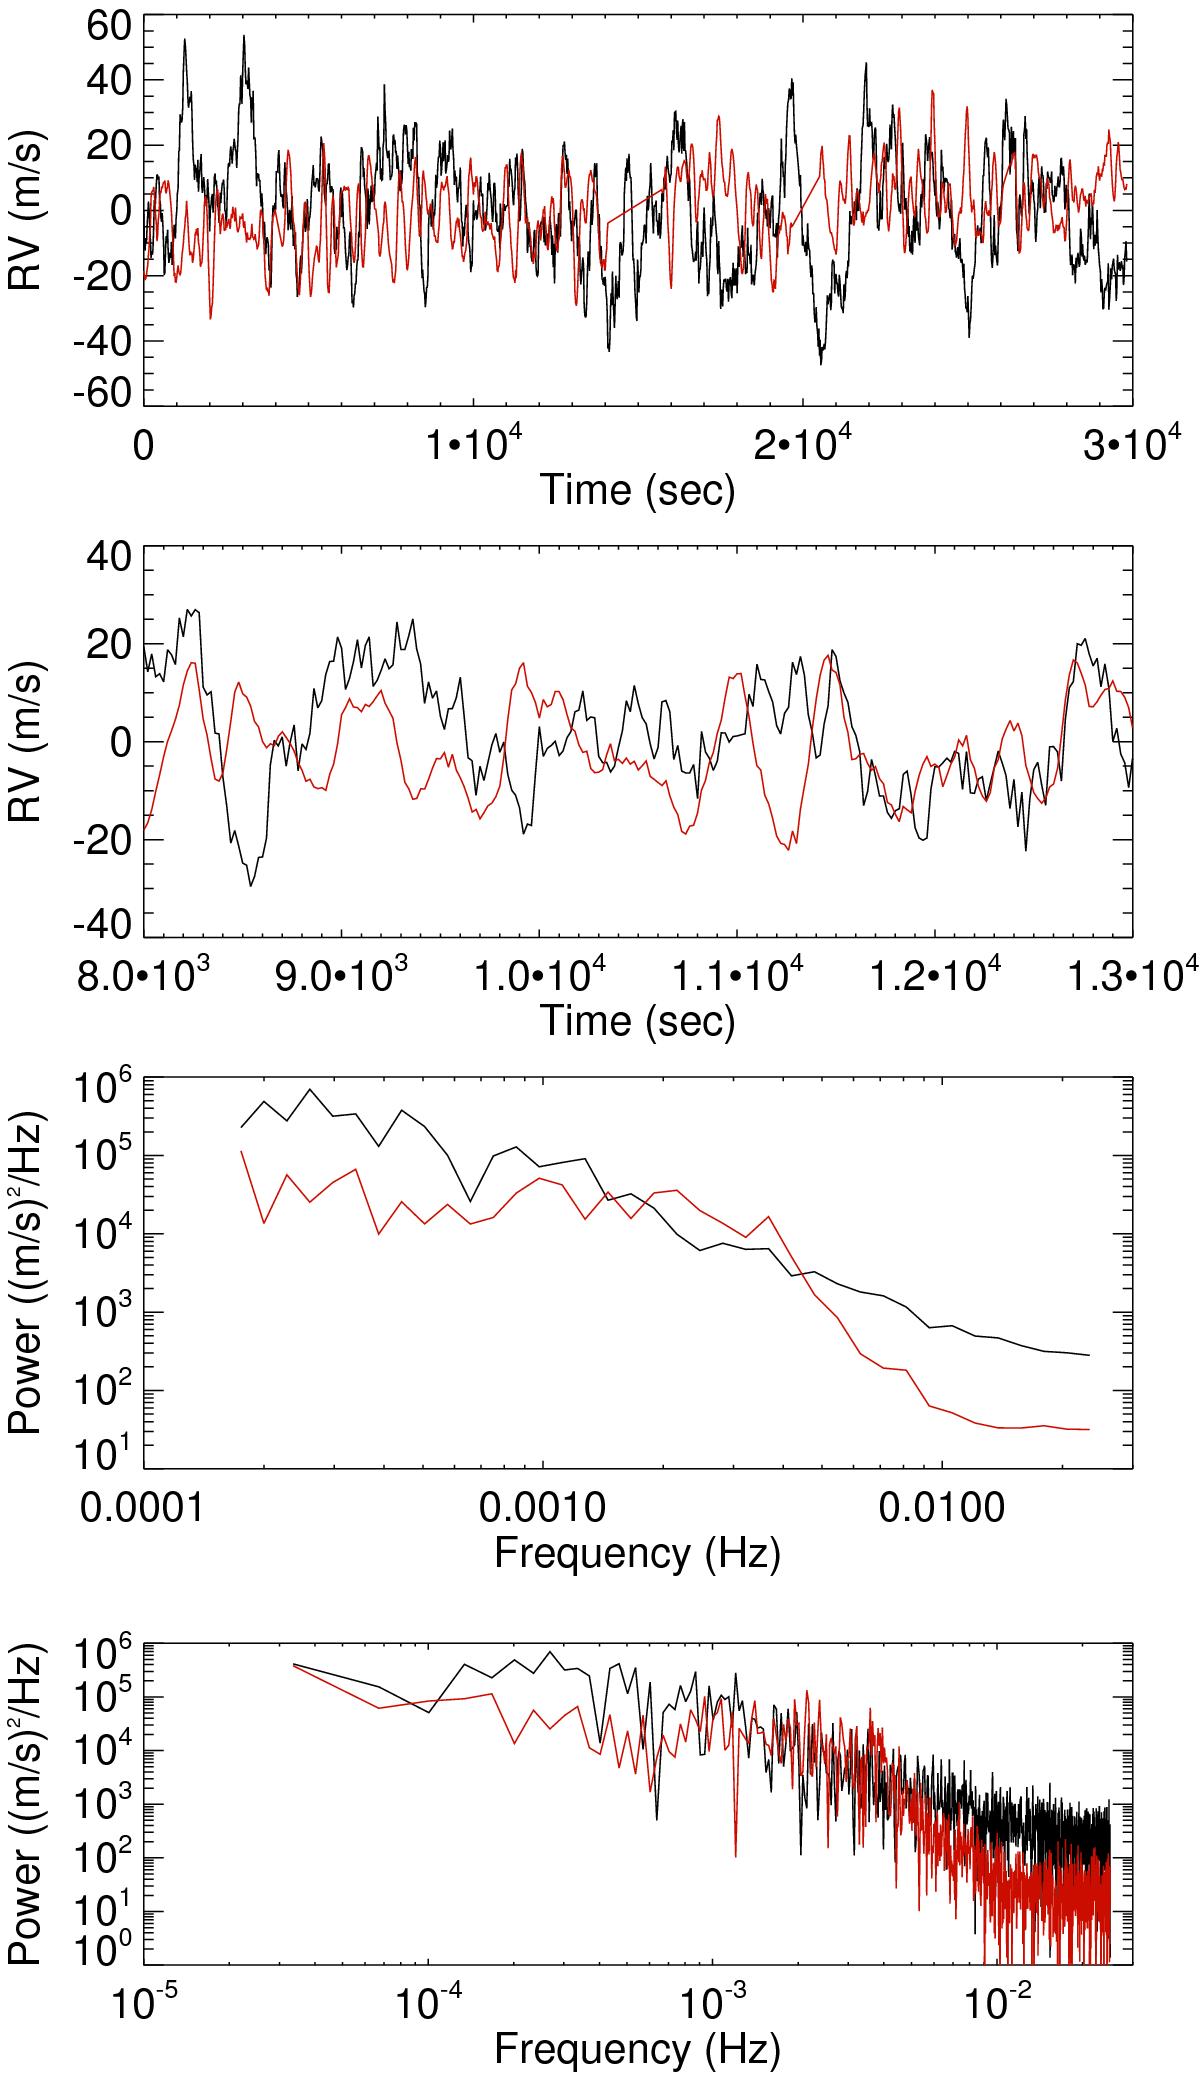
First panel: RV time series for our small field-of-view simulation (black) and the convection simulation of Rieutord et al. (2002) (red). Second panel: zoom on the previous plot for a coverage of 5000 s. Third panel: smoothed power spectra for both time series. Fourth panel: same for the unsmoothed power spectra.
Current usage metrics show cumulative count of Article Views (full-text article views including HTML views, PDF and ePub downloads, according to the available data) and Abstracts Views on Vision4Press platform.
Data correspond to usage on the plateform after 2015. The current usage metrics is available 48-96 hours after online publication and is updated daily on week days.
Initial download of the metrics may take a while.