Fig. A.1
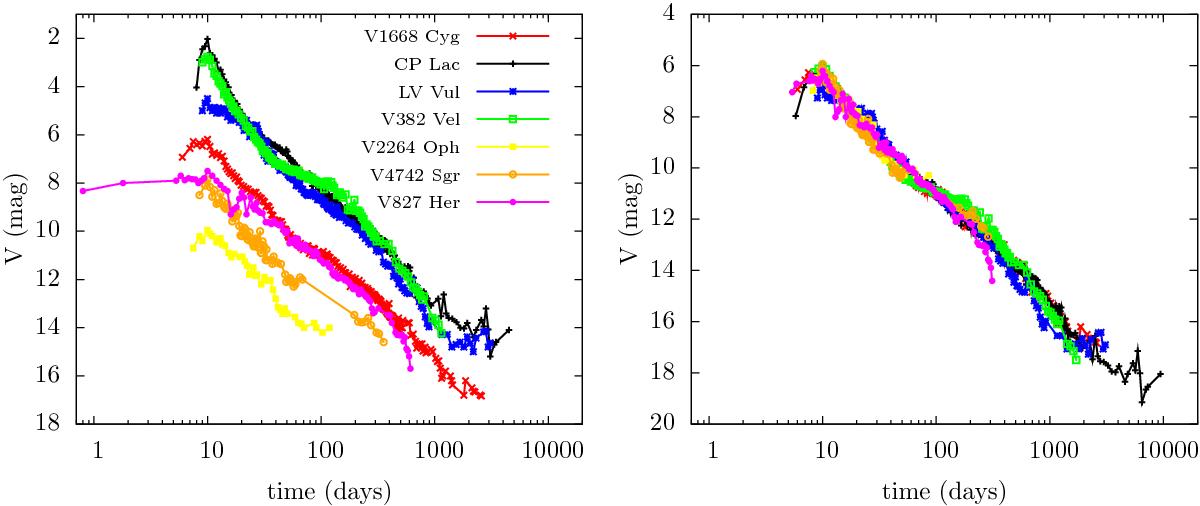
Light curves of the sample selected from the S class of the catalog compiled by Strope et al. (2010) with all the peaks aligned at t = 10 days by a linear shift along the time axis (left) and the resulting transformed curves after stretching in time and shifting in magnitude with respect to the reference light curve of V1668 Cyg according to Eq. (A.1)(right).
Current usage metrics show cumulative count of Article Views (full-text article views including HTML views, PDF and ePub downloads, according to the available data) and Abstracts Views on Vision4Press platform.
Data correspond to usage on the plateform after 2015. The current usage metrics is available 48-96 hours after online publication and is updated daily on week days.
Initial download of the metrics may take a while.