Fig. 7
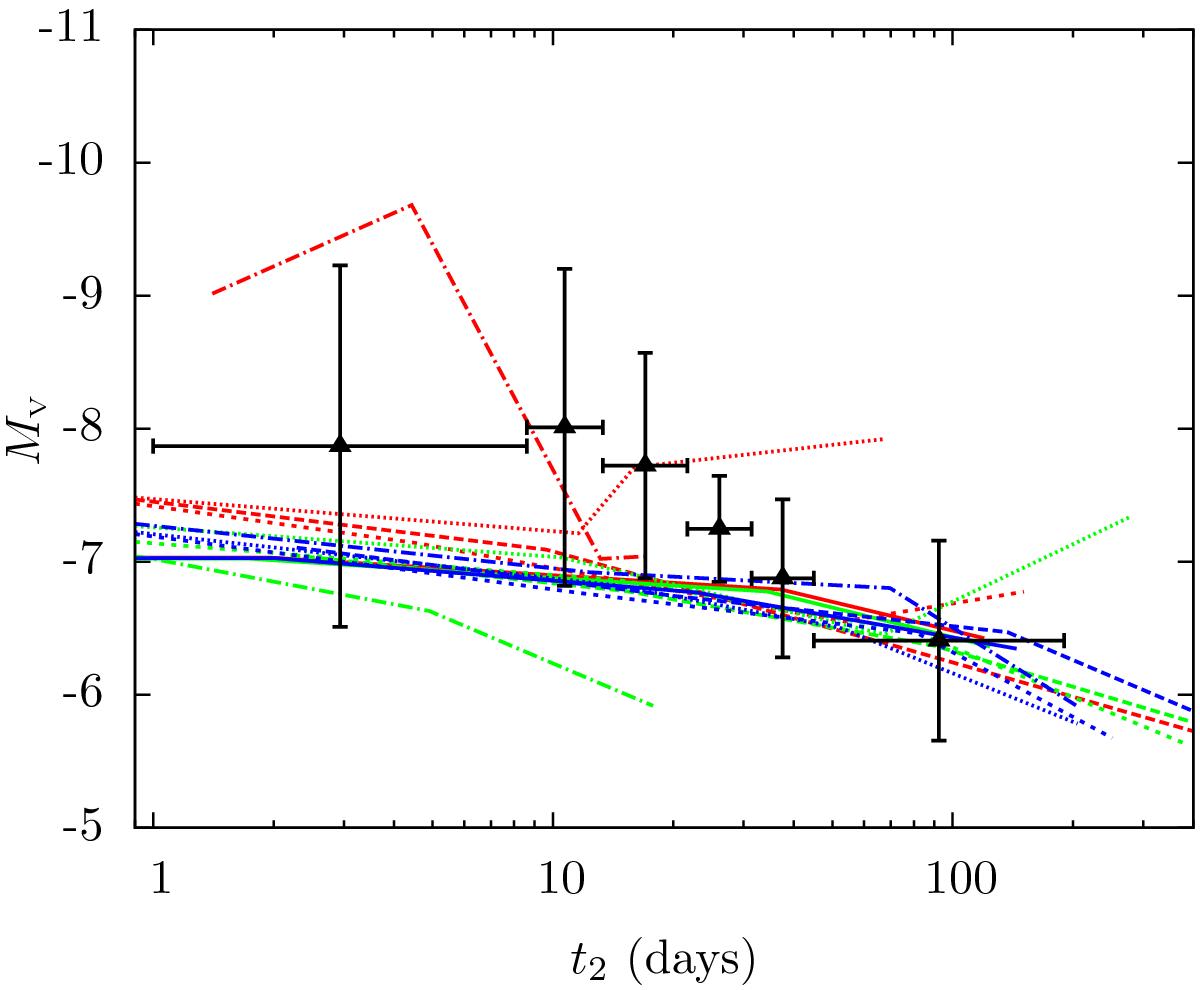
Comparison of the data shown in Fig. B.1 with the results of multicycle nova models of Yaron et al. (2005). The black triangles and vertical error bars show the average peak magnitudes and their rms deviation for the novae grouped in equipopulated bins over the t2 time, and the curves are corresponding relations for the nova models of Yaron et al. (2005). The red, green and blue curves correspond to WD core temperature of 107 K, 3 × 10⁷ K and 5 × 10⁷ K, respectively. The solid curves are for Ṁ = 10-7M⊙ yr-1, dashed curves for Ṁ = 10-8M⊙ yr-1, short dashed curves for Ṁ = 10-9M⊙ yr-1, dotted curves for Ṁ = 10-10M⊙ yr-1, and dot-dashed curves for Ṁ = 10-11M⊙ yr-1.
Current usage metrics show cumulative count of Article Views (full-text article views including HTML views, PDF and ePub downloads, according to the available data) and Abstracts Views on Vision4Press platform.
Data correspond to usage on the plateform after 2015. The current usage metrics is available 48-96 hours after online publication and is updated daily on week days.
Initial download of the metrics may take a while.