Fig. 4
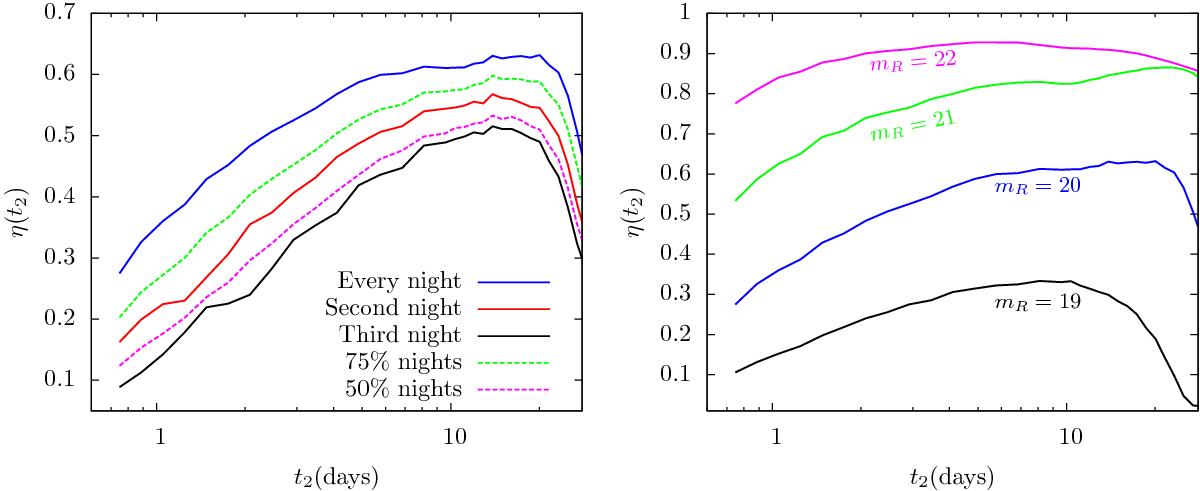
Detection efficiency for novae in M 31 as a function of their decline time t2 for surveys with the limiting magnitude of mR = 20 and different temporal sampling (left) and for surveys of different limiting magnitudes with observations performed every night (right). The decline of the detection efficiency for slow novae is caused by their lower peak magnitudes and the finite time span of the simulated survey (see Sect. 4).
Current usage metrics show cumulative count of Article Views (full-text article views including HTML views, PDF and ePub downloads, according to the available data) and Abstracts Views on Vision4Press platform.
Data correspond to usage on the plateform after 2015. The current usage metrics is available 48-96 hours after online publication and is updated daily on week days.
Initial download of the metrics may take a while.