Fig. 3
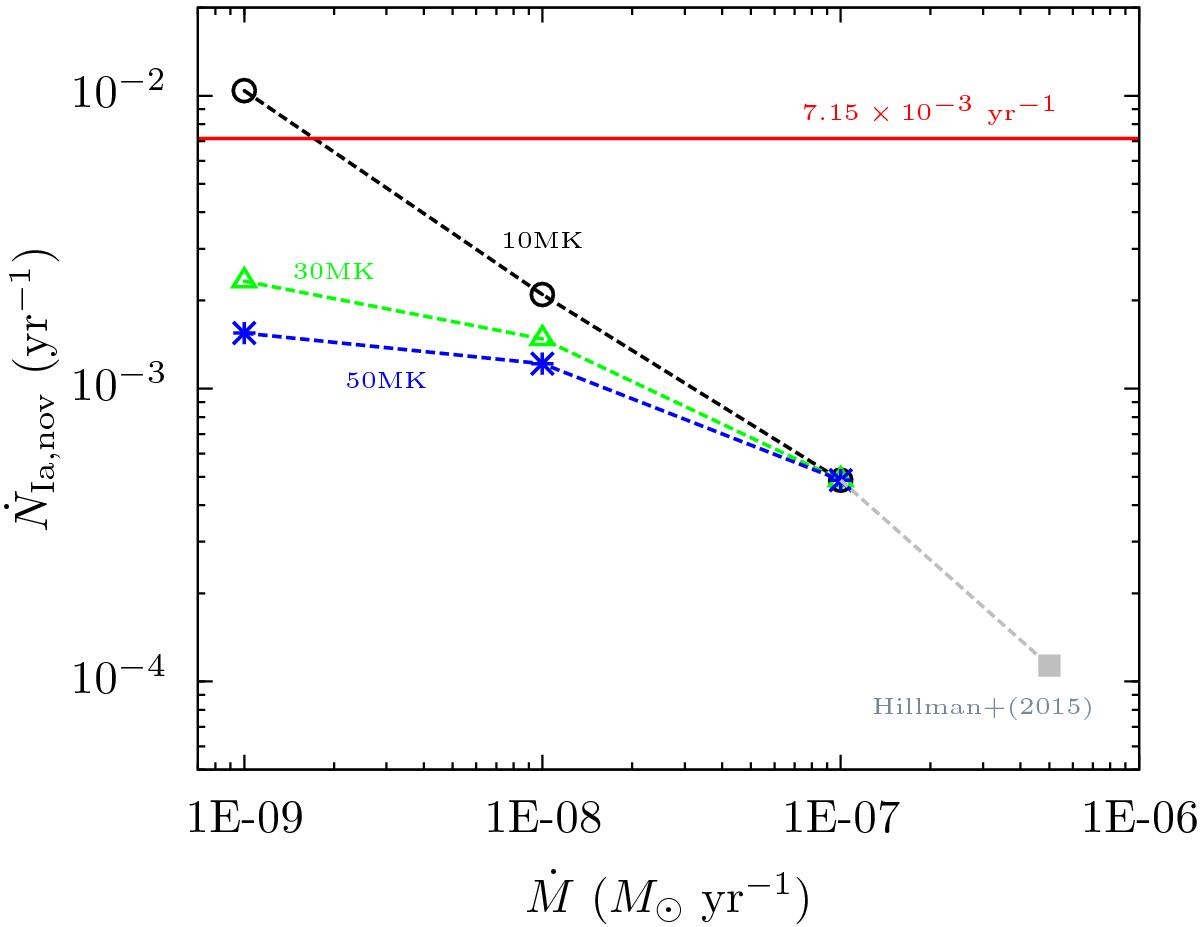
Maximal contribution of novae to the SN Ia rate of M 31 as a function of assumed mass accretion rate for different values of WD core temperature as indicated by the numbers near the curves. The point at Ṁ = 5 × 10⁻⁷M⊙ yr-1 (shown in gray) is computed from the models of Hillman et al. (2015); other points are computed based on Yaron et al. (2005) nova models. The red solid line shows the M 31 supernova rate.
Current usage metrics show cumulative count of Article Views (full-text article views including HTML views, PDF and ePub downloads, according to the available data) and Abstracts Views on Vision4Press platform.
Data correspond to usage on the plateform after 2015. The current usage metrics is available 48-96 hours after online publication and is updated daily on week days.
Initial download of the metrics may take a while.