Fig. 2
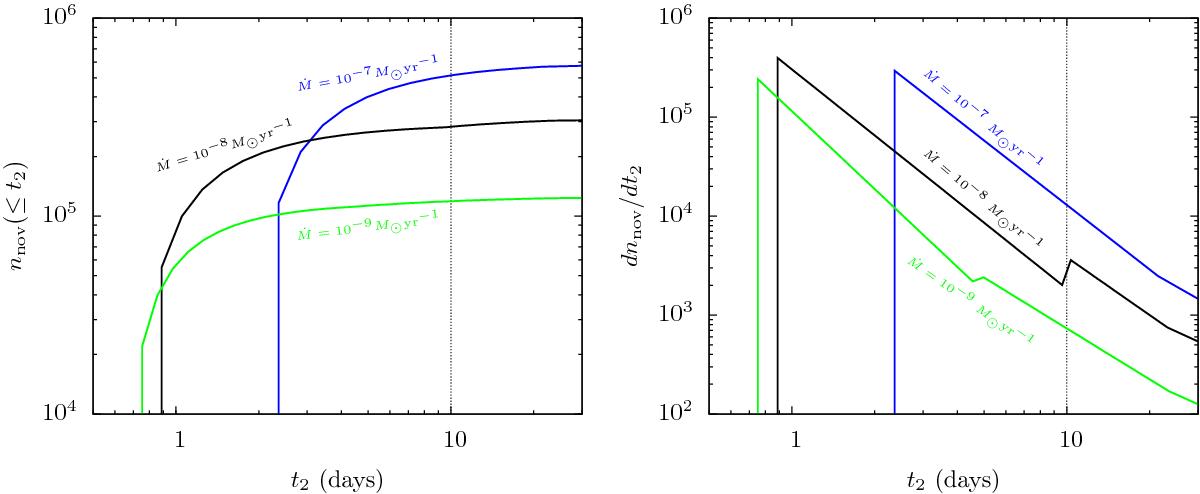
Cumulative (left) and differential (right) t2 distributions of novae produced by one successful SN Ia progenitor, assuming that it accreted in the unstable nuclear burning regime throughout its entire accretion history. The numbers near the curves indicate the mass-accretion rate. The discontinuities in the differential distributions are caused by the discontinuity in the slope of log-linear interpolation of t2 and MWD values from Yaron et al. (2005) tabulation. They do not affect the cumulative distribution in any significant way, as can be seen in the left panel. The sharp drop in the distributions at low t2 values corresponds to the fastest novae produced by the WD near the Chandrasekhar mass limit.
Current usage metrics show cumulative count of Article Views (full-text article views including HTML views, PDF and ePub downloads, according to the available data) and Abstracts Views on Vision4Press platform.
Data correspond to usage on the plateform after 2015. The current usage metrics is available 48-96 hours after online publication and is updated daily on week days.
Initial download of the metrics may take a while.