Fig. B.1
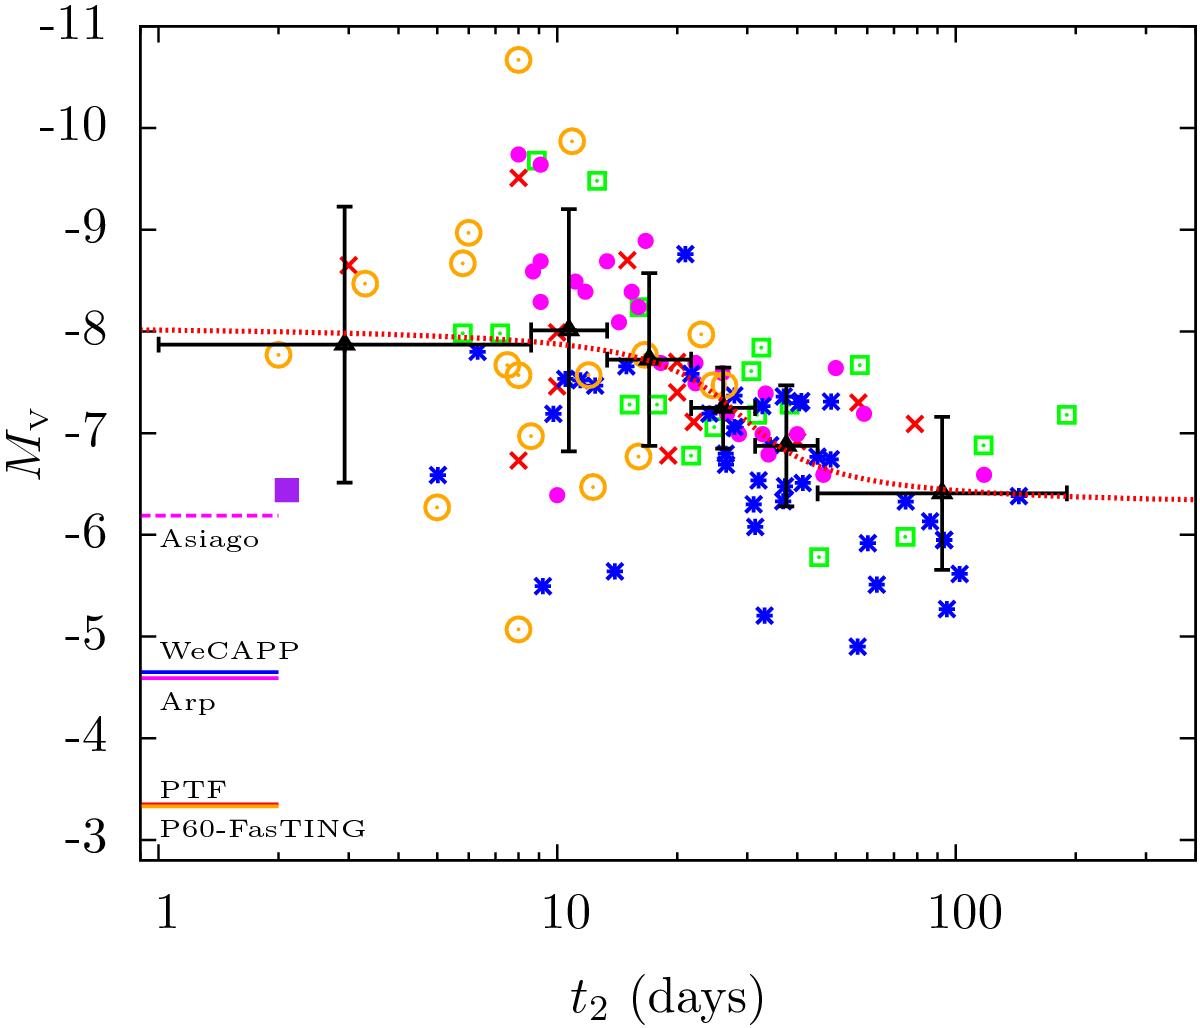
Relation between the maximum magnitude and the rate of decline for extragalactic novae. The PTF data are shown by red × symbols, WeCAPP – blue stars, Shafter et al. (2011) data – green squares, Capaccioli et al. (1989) data – magenta filled circles, Kasliwal et al. (2011) data – orange open circles, and the purple square is the recurrent nova M 31N 2008-12a in M 31. The black triangles represent the averages in the bins, and the red dotted line is our fit. The line segments on the left side mark the approximate limiting magnitudes of the surveys (as shown by the legend).
Current usage metrics show cumulative count of Article Views (full-text article views including HTML views, PDF and ePub downloads, according to the available data) and Abstracts Views on Vision4Press platform.
Data correspond to usage on the plateform after 2015. The current usage metrics is available 48-96 hours after online publication and is updated daily on week days.
Initial download of the metrics may take a while.