Fig. 7
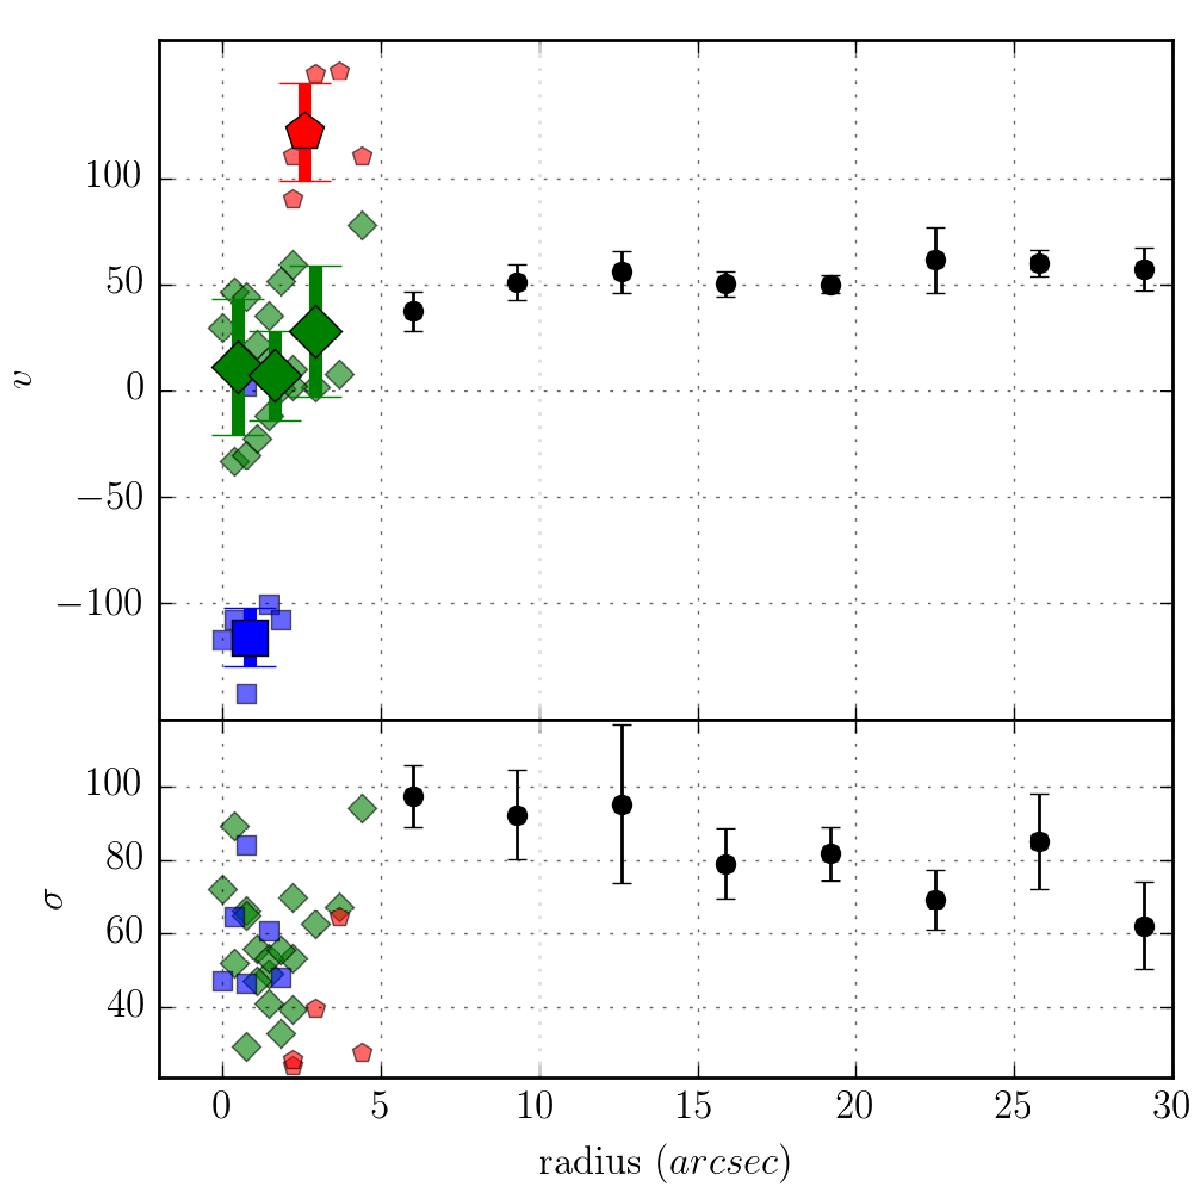
Line-of-sight velocity of gaseous emission lines along PA −45°. Black dots are the [O iii] velocities and line-of-sight σ from our VIMOS data. The error bars for all points represent the spread (1σ) of the individual measurements within the radial bin, not the measurement error. Green, red, and blue dots correspond to the first, second, and third velocity component from the ARGUS analysis of the [S iii] line (cf. Fig. 5), as derived by a cut through the velocity field in the north-west direction. Small symbols represent individual spaxels and large symbols radial averages with error bars showing the spread. The scale is 0.4 kpc/arcsec.
Current usage metrics show cumulative count of Article Views (full-text article views including HTML views, PDF and ePub downloads, according to the available data) and Abstracts Views on Vision4Press platform.
Data correspond to usage on the plateform after 2015. The current usage metrics is available 48-96 hours after online publication and is updated daily on week days.
Initial download of the metrics may take a while.