Fig. 6
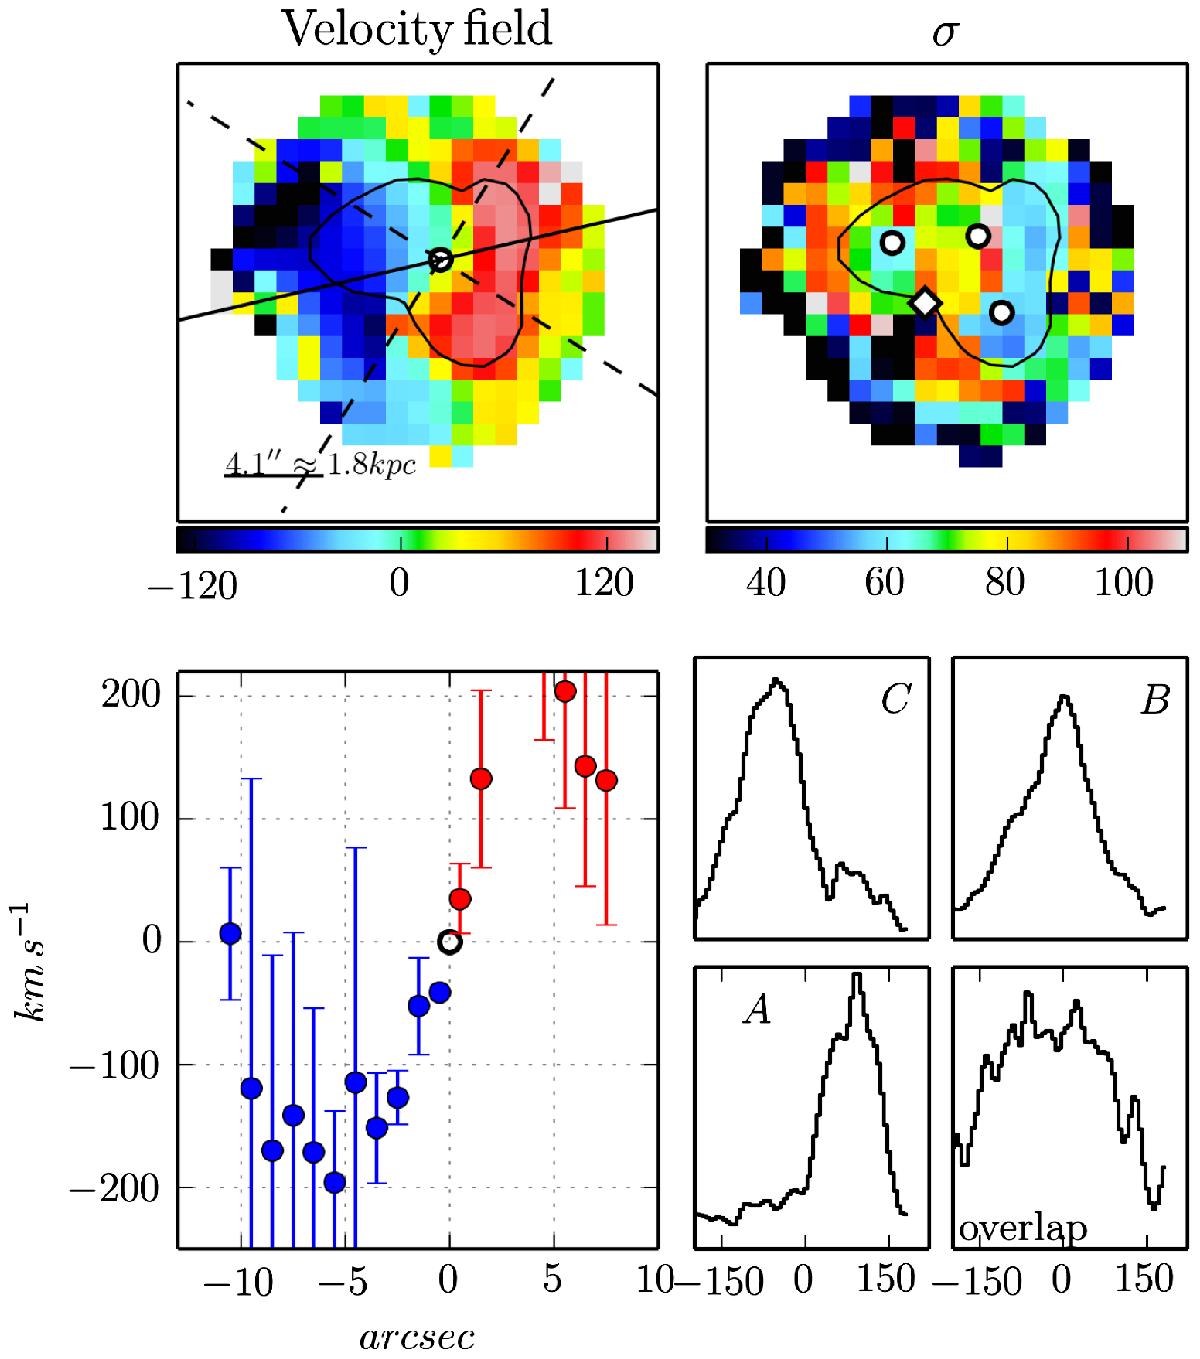
Results from CIGALE Fabry-Perot Hα observations of Haro 11. Upper left: line-of-sight velocity (relative to the systemic velocity) with the scale (in km s-1) given by the colour bar beneath. The spatial scale is indicated in the corner and a single Hα flux contour (at ~5 × 10-15 erg s-1cm-2 arcsec-2) is over-plotted for reference. The solid black line shows the line along which the rotation curve (in the lower left panel) was extracted and the dashed lines indicate the ± 40deg wedge of points included. Upper right: velocity dispersion map. The same contour as in the first panel is over-plotted. The white circles mark the positions of knots ![]() , ℬ, and
, ℬ, and ![]() , and diamond marks the overlap region. Lower left: rotation curve, derived by deprojecting the apparent position of each velocity point to its radius in the inclined plane, using the position angle and wedge indicated in the upper left panel. The error bars correspond to the spread of the velocity measurements within each one arcsecond wide radial bin. Lower right: example of Hα profiles from the locations of the three knots and the overlap region.
, and diamond marks the overlap region. Lower left: rotation curve, derived by deprojecting the apparent position of each velocity point to its radius in the inclined plane, using the position angle and wedge indicated in the upper left panel. The error bars correspond to the spread of the velocity measurements within each one arcsecond wide radial bin. Lower right: example of Hα profiles from the locations of the three knots and the overlap region.
Current usage metrics show cumulative count of Article Views (full-text article views including HTML views, PDF and ePub downloads, according to the available data) and Abstracts Views on Vision4Press platform.
Data correspond to usage on the plateform after 2015. The current usage metrics is available 48-96 hours after online publication and is updated daily on week days.
Initial download of the metrics may take a while.