Fig. 5
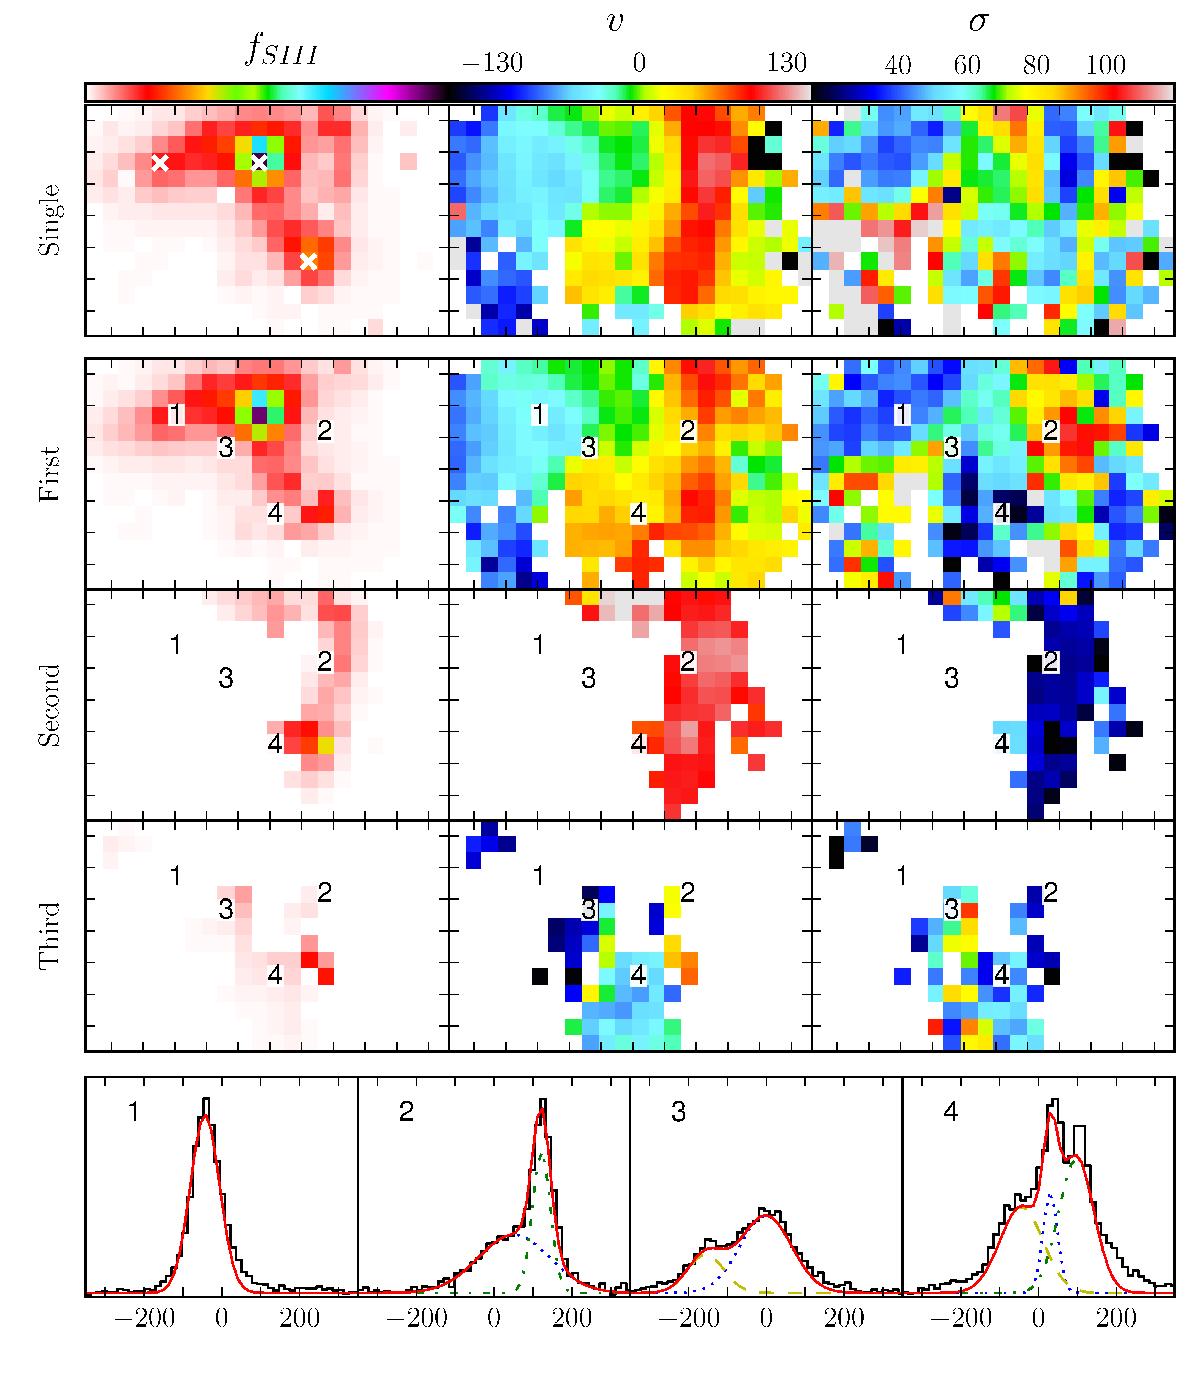
Maps of the field of view of FLAMES/ARGUS showing the derived properties of the [S iii] λ9069 line. The tick marks have a spacing of 1′′. Upper row: results from a single component fit, from left to right: intensity in arbitrary logarithmic units (with the location of the 3 knots indicated with crosses), velocity and velocity dispersion. Since we find that over large areas, a single velocity component is insufficient to reproduce the line profile, we present an attempt to decompose the line by fitting multiple Gaussians. The number of components was chosen conservatively and additional components were only included when deemed necessary to produce a decent fit. The results are presented in the three middle rows. Lower row: examples of measured [S iii] line profiles (black solid line), and our multi-component fits to them (first: blue dotted, second: green dash-dotted, third: yellow dashed). The red solid line is the sum of the components. The x-axis indicates velocity, relative to the systemic velocity, in km s-1. The positions that correspond to the spectra are shown with numbers over-plotted on the panels above them.
Current usage metrics show cumulative count of Article Views (full-text article views including HTML views, PDF and ePub downloads, according to the available data) and Abstracts Views on Vision4Press platform.
Data correspond to usage on the plateform after 2015. The current usage metrics is available 48-96 hours after online publication and is updated daily on week days.
Initial download of the metrics may take a while.