Fig. 4
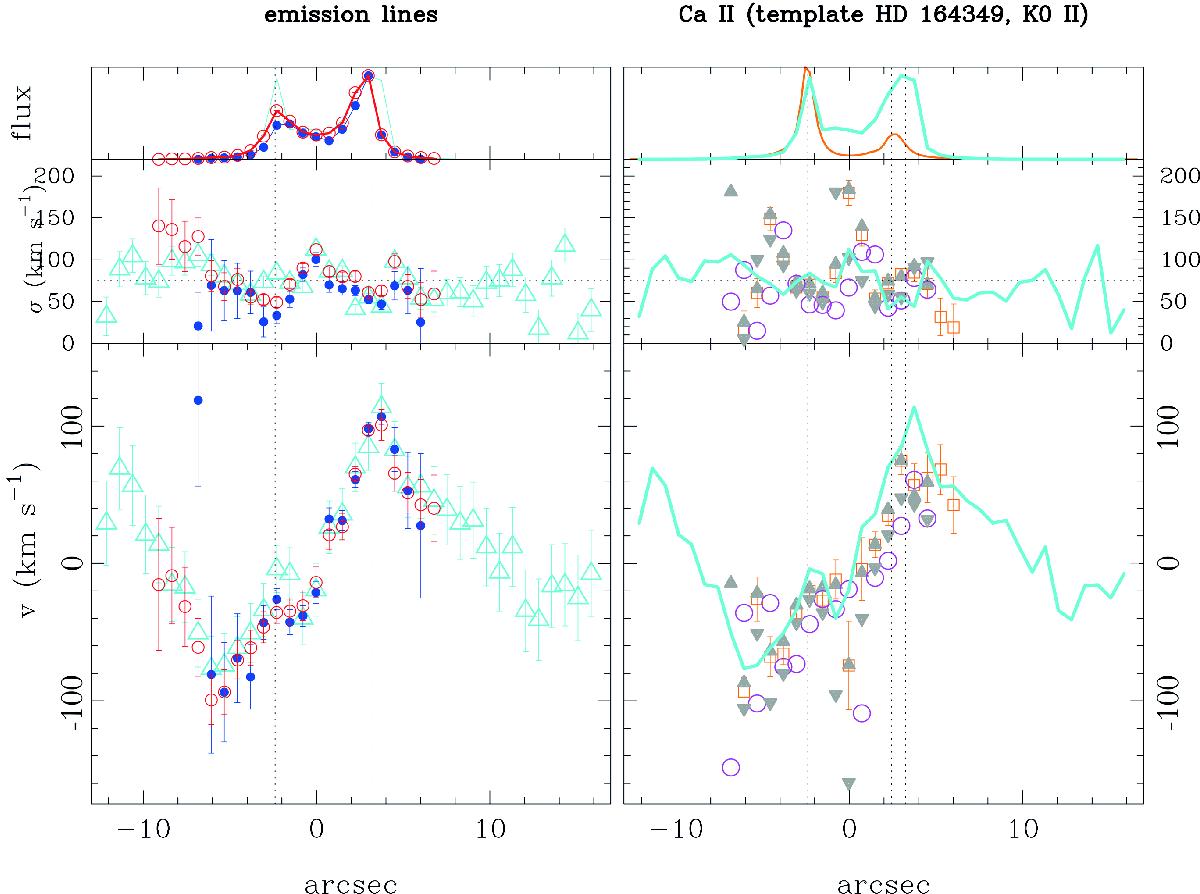
Same as Fig. 3, but for slit ![]() , and with the addition of Hα measurements (cyan triangles). In the right panels, the cyan full-drawn line repeats the Hα measurements from the left panels to allow for comparison of the stellar and ionised gas kinematics. Dotted vertical lines mark the positions of knots
, and with the addition of Hα measurements (cyan triangles). In the right panels, the cyan full-drawn line repeats the Hα measurements from the left panels to allow for comparison of the stellar and ionised gas kinematics. Dotted vertical lines mark the positions of knots ![]() (left dotted line) and
(left dotted line) and ![]() (two rightmost dotted lines); see Fig. 1.
(two rightmost dotted lines); see Fig. 1.
Current usage metrics show cumulative count of Article Views (full-text article views including HTML views, PDF and ePub downloads, according to the available data) and Abstracts Views on Vision4Press platform.
Data correspond to usage on the plateform after 2015. The current usage metrics is available 48-96 hours after online publication and is updated daily on week days.
Initial download of the metrics may take a while.