Fig. 3
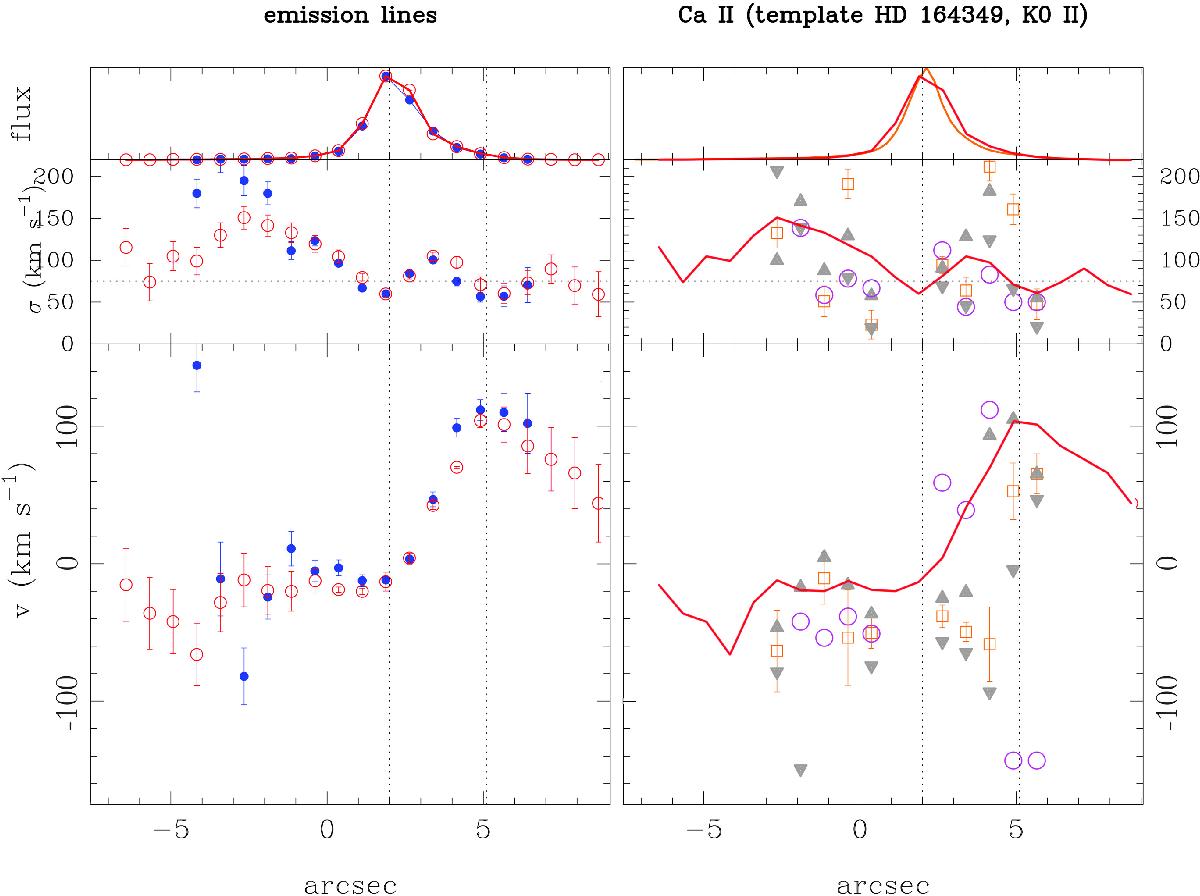
Kinematical results along FORS2 slit ℬ showing (from upper to lower) the flux level, the line-of-sight velocity dispersion, and the heliocentric radial velocity (relative to the systemic velocity of 6175 km s-1). Zero on the abscissa is defined as the point where our two slits cross. The left panels show results for the [S iii] λ9069 (red open circles), and H i Paschen emission lines (weighted means of all measured lines; blue filled circles). The flux scale show the normalised strengths of the emission lines. The dotted vertical lines at 2′′ and 5′′ marks the position along the slit of knot ℬ, and where the slit crosses the loop of structures is referred to as the ear (see also Figs. 1 and 6). The dotted horizontal line in the σ-plot is arbitrarily put at 75 km s-1. The right panel shows at the top the spatial variation of the normalised continuum flux near the calcium triplet (orange), in arbitrary units. The red solid line repeats the [S iii] flux distribution from the left panel. The middle and lower panels show the derived stellar velocity dispersion and radial velocity, respectively. Again, the red solid line repeats the [S iii] results from the left panels. The results from cross-correlation is shown with orange squares and the pPXF is shown as magenta open circles. The grey triangles represent the extreme values derived (as described in Sect. 3.2) from the cross-correlation method when we take systematics in the Paschen emission line subtraction into account. At the distance of Haro 11, 10′′ corresponds to 4 kpc.
Current usage metrics show cumulative count of Article Views (full-text article views including HTML views, PDF and ePub downloads, according to the available data) and Abstracts Views on Vision4Press platform.
Data correspond to usage on the plateform after 2015. The current usage metrics is available 48-96 hours after online publication and is updated daily on week days.
Initial download of the metrics may take a while.