Fig. 2
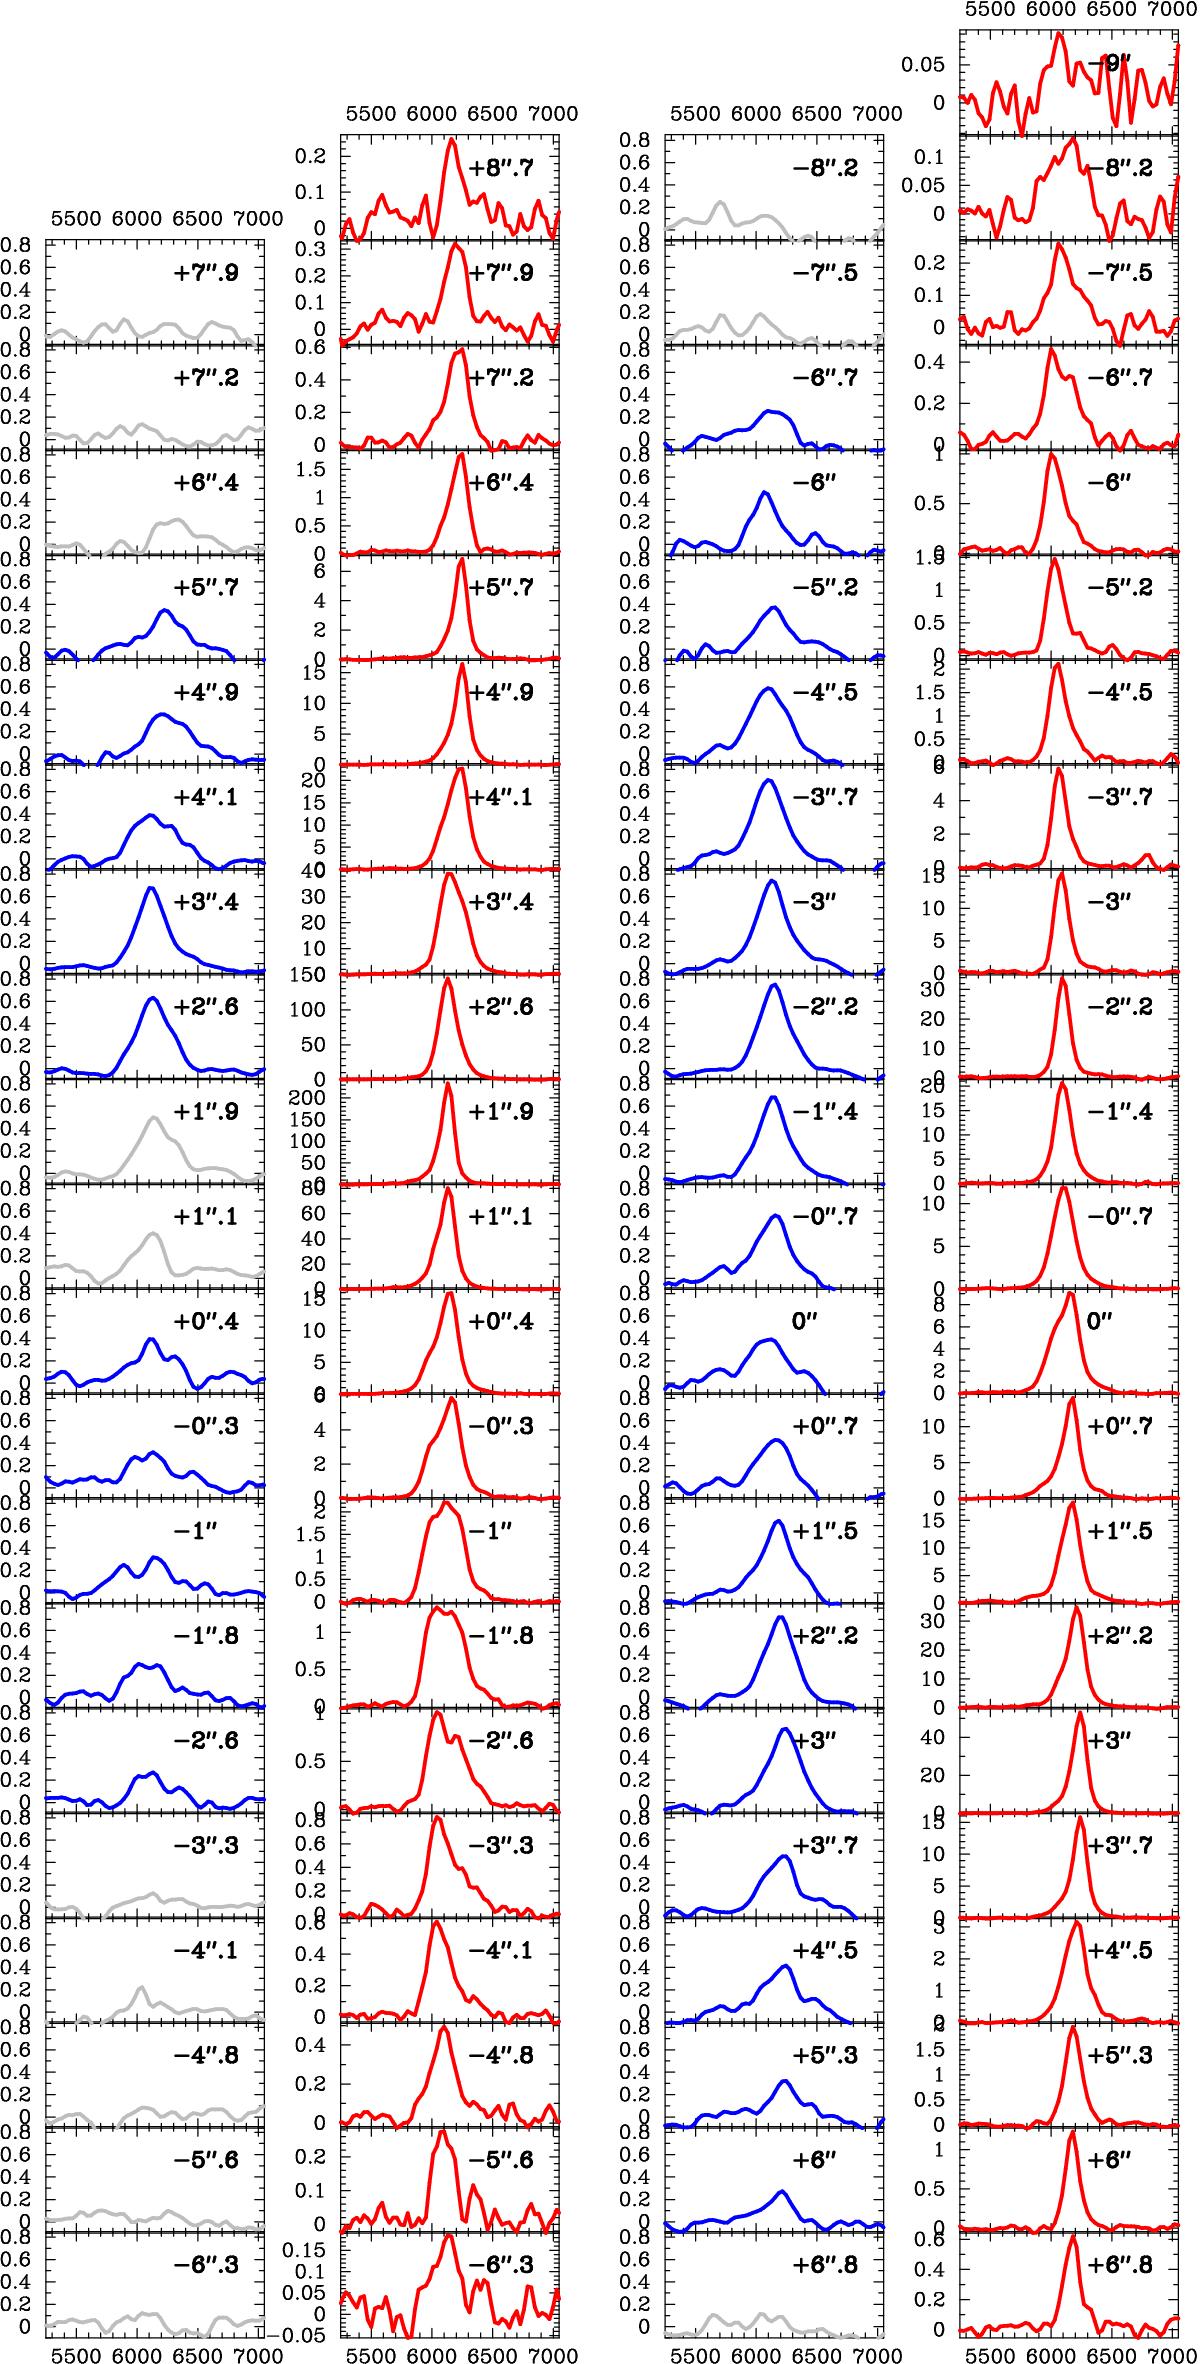
Variation along the slit of the cross-correlation function (CCF, first and third columns) from fxcor and the [S iii] λ9069 line profile (second and fourth columns). The leftmost two columns show the results for slit ℬ and the rightmost columns the results for slit ![]() . Where the CCF peak value is smaller than 0.25 or the Paschen subtraction is deemed unreliable, the CCF is shown in grey. The emission-line profiles have been continuum-subtracted. Each sub-panel is labelled with the position of the extraction window, where the origin is set to the position where the two slits cross (see Fig. 1). Knot ℬ is at position +1.̋9 along slit ℬ, and knots
. Where the CCF peak value is smaller than 0.25 or the Paschen subtraction is deemed unreliable, the CCF is shown in grey. The emission-line profiles have been continuum-subtracted. Each sub-panel is labelled with the position of the extraction window, where the origin is set to the position where the two slits cross (see Fig. 1). Knot ℬ is at position +1.̋9 along slit ℬ, and knots ![]() and
and ![]() are at −2.̋2 and + 3′′ along slit
are at −2.̋2 and + 3′′ along slit ![]() , respectively.
, respectively.
Current usage metrics show cumulative count of Article Views (full-text article views including HTML views, PDF and ePub downloads, according to the available data) and Abstracts Views on Vision4Press platform.
Data correspond to usage on the plateform after 2015. The current usage metrics is available 48-96 hours after online publication and is updated daily on week days.
Initial download of the metrics may take a while.