| Issue |
A&A
Volume 582, October 2015
|
|
|---|---|---|
| Article Number | L7 | |
| Number of page(s) | 4 | |
| Section | Letters | |
| DOI | https://doi.org/10.1051/0004-6361/201527267 | |
| Published online | 09 October 2015 | |
Nonazimuthal linear polarization in protoplanetary disks
1 Departamento de Física y Astronomía, Universidad de Valparaíso, 951 Valparaíso, Chile
e-mail: This email address is being protected from spambots. You need JavaScript enabled to view it.
2 UMI-FCA, CNRS/INSU, France (UMI 3386), and Dept. de Astronomía, Universidad de Chile, Casilla 36-D Santiago, Chile
3 Leiden Observatory, Universiteit Leiden, PO Box 9513, 2300 RA Leiden, The Netherlands
4 Departamento de Astronomía, Universidad de Chile, Casilla 36- D Santiago, Chile
5 Millennium Nucleus Protoplanetary Disks in ALMA Early Science, Casilla 36- D Santiago, Chile
Received: 28 August 2015
Accepted: 17 September 2015
Abstract
Several studies discussing imaging polarimetry observations of protoplanetary disks use the so-called radial Stokes parameters Qφ and Uφ to discuss the results. This approach has the advantage of providing a direct measure of the noise in the polarized images under the assumption that the polarization is only azimuthal, i.e., perpendicular to the direction toward the illuminating source. However, a detailed study of the validity of this assumption is currently missing. We aim to test whether departures from azimuthal polarization can naturally be produced by scattering processes in optically thick protoplanetary disks at near infrared wavelengths. We use the radiative transfer code MCFOST to create a generic model of a transition disk using different grain size distributions and dust masses. From these models we generate synthetic polarized images at 2.2 μm. We find that even for moderate inclinations (e.g., i = 40°), multiple scattering alone can produce significant (up to ~ 4.5% of the Qφ image, peak-to-peak) nonazimuthal polarization reflected in the Uφ images. We also find that different grain populations can naturally produce radial polarization (i.e., negative values in the Qφ images). Despite the simplifications of the models, our results suggest that caution is recommended when interpreting polarized images by only analyzing the Qφ and Uφ images. We find that there can be astrophysical signal in the Uφ images and negative values in the Qφ images, which indicate departures from azimuthal polarization. If significant signal is detected in the Uφ images, we recommend checking the standard Q and U images to look for departures from azimuthal polarization. On the positive side, signal in the Uφ images once all instrumental and data-reduction artifacts have been corrected for means that there is more information to be extracted regarding the dust population and particle density.
Key words: scattering / techniques: polarimetric / circumstellar matter / stars: variables: T Tauri, Herbig Ae/Be
© ESO, 2015
1. Introduction
With the advent of high contrast imaging polarimeters, such as NaCo/VLT (Lenzen et al. 2003), HiCiao/Subaru (Tamura et al. 2006), GPI/Gemini South (Macintosh et al. 2008), and SPHERE/VLT (Beuzit et al. 2008), polarized differential imaging (PDI) has become a standard tool to directly image and analyze the dusty circumstellar environments around young and evolved stars (e.g., Canovas et al. 2012, 2015a; Jeffers et al. 2012, 2014; Garufi et al. 2013; Min et al. 2013). In disks, PDI have proven powerful to show a variety of features like spiral arms, bright inner rings and/or disk asymmetries revealing complex morphologies. However, the yield products of this technique are generally polarized intensity (PI) maps, and rarely intensity and fractional polarization (P) maps. The optical properties of dust grains and their dependence on composition and scattering angle have a significant impact on the polarization of the scattered light (e.g., Murakawa 2010; Min et al. 2012). Multiple scattering and optical thickness can also modify the observed polarization. Therefore, PI maps may not always accurately trace the underlying surface brightness distribution, and even less so the surface density distribution (as in AB Aurigae, see Perrin et al. 2009).
Recently, it has become popular to analyze linearly polarized images of protoplanetary disks using the so-called radial-Stokes formalism (Schmid et al. 2006; Avenhaus et al. 2014). This is extremely useful because it allows us to quantify and control the calibration errors potentially to high degrees of accuracy. This formalism relies on the assumption that the linear polarization in disks is perpendicular to the scattering plane defined by the light source (star), the scattering particle, and the observer, i.e., it is purely azimuthal. Any nonazimuthal polarization is associated with noise and/or calibration errors. While this is valid when single scattering dominates in nearly face-on disks, the assumption may break down for higher disk inclinations and for peculiar dust properties (as for those of comets, e.g., Kelley et al. 2004), when grains are aligned (Matsumura & Seki 1996; Wolf et al. 2002), and/or when disks are optically thick and multiple scattering occurs (Bastien & Menard 1988). In this letter, we explore some of these deviations and quantify their impact on the use of the radial-Stokes formalism at near-infrared (NIR) wavelengths.
2. Modeling
The goal of this study is to demonstrate that departures from centrosymmetric azimuthal polarization may occur in protoplanetary disks for several cases. To prove this we build a simple but realistic model of a transition disk using the 3D radiative transfer code MCFOST (Pinte et al. 2006, 2009). The radial structure of the model is similar to that found in the well-studied disks RX J1633.9-2442 and Sz 91 (Cieza et al. 2012; Canovas et al. 2015b): the innermost region is completely devoid of dust, followed by a dust-depleted region extending up to the cavity radius (“Region 1”), and the outer disk (“Region 2”).
2.1. Disk structure
The exact choice of the disk geometry and stellar type has a minimal impact on our study of the polarization when compared to the effect of dust grain properties and/or optical thickness. We assume the disk to be at the distance of the Taurus star-forming region (140 pc), with a central star with mass of 1 M⊙, effective temperature of T⋆ = 4300 K, and radius of R⋆ = 2.6 R⊙. This roughly corresponds to a K6 star of age ~ 1 Myr (Siess et al. 2000). The disk has an inner cavity of 40 au in radius (Rcav) containing 10-9M⊙ of dust (optically thin at NIR), with the innermost 10 au totally devoid of dust. The surface density distribution of this inner disk is governed by a power-law Σ(r) = Σ100(r/ 100 au)− p, where Σ100 is the surface density at r = 100 au. The surface density distribution of the outer disk is described by a tapered-edge profile ![Mathematical equation: \begin{equation} \Sigma (r) = \Sigma_{\rm C} \, r^{-\gamma} \, \mathrm{exp} \left [- \left (\frac{r}{R_{\rm{C}}} \right) ^{2-\gamma} \right], \label{eq:eq1} \end{equation}](/articles/aa/full_html/2015/10/aa27267-15/aa27267-15-eq20.png) (1)where ΣC is the surface density at the characteristic radius RC, and γ corresponds to the viscosity power-law index in accretion disk theory (ν ∝ Rγ, Hartmann et al. 1998). The scale height is described assuming that the dust follows a Gaussian vertical density profile in both the inner and outer disks H(r) = H100(r/ 100 au)ψ, where H100 is the scale height at r = 100 au, and ψ is the flaring parameter of the disk. The optical depth is changed using different outer disk’s dust masses.
(1)where ΣC is the surface density at the characteristic radius RC, and γ corresponds to the viscosity power-law index in accretion disk theory (ν ∝ Rγ, Hartmann et al. 1998). The scale height is described assuming that the dust follows a Gaussian vertical density profile in both the inner and outer disks H(r) = H100(r/ 100 au)ψ, where H100 is the scale height at r = 100 au, and ψ is the flaring parameter of the disk. The optical depth is changed using different outer disk’s dust masses.
2.2. Dust properties
Models show that the polarizability curve of different grain types is positive (polarization perpendicular to the scattering plane) in most cases, but it can have a negative branch producing polarization parallel to the scattering plane (i.e., radial polarization, see Perrin et al. 2009; Canovas et al. 2013; Kirchschlager & Wolf 2014). Although the detailed composition of disk grains is difficult to constrain, observational evidence indicates that cosmic dust particles are mostly composed of silicates and, in lower quantity, carbonaceous particles (Draine & Lee 1984; Draine 2003). For our modeling, we use grain particles composed of a mixture in volume of 70% astronomical silicates (Draine & Lee 1984) and 30% amorphous carbon particles (Li & Greenberg 1997) following a standard power-law size distribution dn(a) ∝ a-3.5da, using different values for the minimum and maximum grain sizes. The full scattering matrix of the dust populations is computed with Mie theory (Mie 1908), using two different methods: assuming distributions of 1) compact homogeneous spheres; and 2) hollow spheres (DHS, Min et al. 2005) with maximum volume fraction fmax = 0.8. The minimum and maximum grain sizes in Region 1 is fixed and these grains are compact. For the outer disk, we explore different values of porosity and minimum and maximum grain sizes. The optical indices are derived using effective medium theory (using Bruggeman’s rule). The model’s parameters are summarized in Table 1.
Model parameters. Subscripts refer to the two regions of the disk.
2.3. Synthetic scattered light images
We use MCFOST to generate synthetic images (Stokes I, Q, and U maps) at 2.2μm of the disk models for several inclinations ranging from pole-on to edge-on. To facilitate the comparison with real observations these images are projected into a grid with pixel size of  (equal to the scale of the S27 camera of NaCo/VLT) and convolved with a 2.5-px width (
 ) Gaussian point spread function (PSF). After convolution, the polarized intensity image is constructed as
  . The radial-Stokes parameters1 are defined as
  where
where  (4)x and y are the coordinates in the image with respect to the star (x0, y0), and θ is the offset created by instrumental polarization (zero in our models).
3. Results and discussion
3.1. The effect of dust properties
The angle at which incident light is scattered and the polarized flux that is produced depends strongly on the detailed properties of the scattering dust particles. The polarizability curves of different grain distributions prove this dependency for single scattering of incident unpolarized light. Figure 1 shows that different grain populations can rotate the polarization plane from perpendicular (positive branch) to parallel (negative branch) with respect to the scattering plane. The first case produces azimuthal polarization patterns (positive signal in the Qφ images), while the second case produces radial polarization (negative values in Qφ). In our models, both the DHS and solid spheres produce significant amounts of radial polarization for amin< 5 μm. Using solid spheres, radial polarization is only expected for angles ≳ 130° (backward scattering). For a protoplanetary disk, this would correspond to scattering on its far side at inclinations i ≳ (40° + α), where α is the flaring angle of the disk. On the other hand, DHS predicts radial polarization for scattering angles ≲ 70° (forward scattering) and 140°−160° (backward scattering), noting that different values of fmax can remove the negative branch for forward scattering angles (Min et al. 2005).
Radial polarization at large scattering angles (backward scattering) has been observed at optical and NIR wavelengths in a number of comets (Kelley et al. 2004; Woodward et al. 2011), and dust grains in protoplanetary disks can have similar compositions to those found in comets (Bouwman et al. 2003). Experimental measurements in the optical show that ensembles of arbitrarily shaped dust aggregates also produce radial polarization patterns at large scattering angles (Muñoz et al. 2000, 2006; Volten et al. 2007). At optical wavelengths models show that porous grains can also produce radial polarization in selected regions of protoplanetary disks at large inclinations (Kirchschlager & Wolf 2014). Therefore, dust properties alone can produce radial polarization in particular for backward scattering.
3.2. The effect of multiple scattering
Multiple scattering of previously polarized light may lead to complex polarization patterns. In particular, the polarization plane of the last scattering event could have an orientation that is neither parallel nor perpendicular to the scattering plane of the first scattering event. This would be reflected in the Uφ images. To describe this case while minimizing the impact of the grain properties, we focus on models with amin ≥ 5 μm, i.e., models with polarizability curves without negative branches (such as the green curve in Fig. 1). The contribution of multiple scattering can be estimated by comparing models with the same grain populations but different masses (i.e., different number of scattering particles), as higher masses produce more scattering events.
Three representative cases are shown in Fig. 2. For each model, the images are normalized with respect to the PI image to facilitate a comparison between the PI,Qφ, and Uφ images. All models are computed using  , amin,max = 5,1000 μm, i = 40°, and DHS. From top to bottom, the outer disk’s dust masses are Mdust2 = 0.5 × [10-8,10-5,10-4] M⊙, corresponding to integrated optical depths at 2.2 μm along the disk’s mid-plane of τ2.2 = [10-3,8.3,83.0]. By construction there is no instrumental polarization in our models and the numerical noise from the Monte Carlo simulation is at most 0.4% of the PI image (peak-to-peak, see the optically thin model in the top row of Fig. 2).
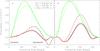 |
Fig. 1 a) Polarizability curves computed at 2.2 μm using solid spheres for amax = 1 mm and different values of amin (see legend). Solid (dashed) lines represent 0% (30%) porous grains. Negative values indicate radial polarization. b) Same as a) using DHS theory with fmax = 0.8. |
We find that multiple scattering can naturally produce observable signatures in the unconvolved Uφ images even in disks with moderate inclination (i = 40°). This is reflected in the Uφ images in Fig. 2, which can have maximum values up to ~ 4.5% of the PI image (peak-to-peak). In all our models, the signal in the Uφ image relative to the PI image increases with inclination and with mass. The Qφ images, on the other hand, are mostly insensitive to this effect. Both the DHS and compact spheres methods produce the same trends. Additionally we find that increasing the porosity slightly increases the signal in Uφ, but this feature becomes undetectable after convolution with the PSF. Instrumental effects like PSF convolution can remove these trends and/or even create artificial signatures in the Uφ images.
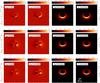 |
Fig. 2 From top to bottom: synthetic images at 2.2 μm for three models (i = 40°) with outer disk masses of Mdust2 = 5 × [10-8,10-5,10-4] M⊙. From left to right, unconvolved Uφ images, and convolved Uφ,Qφ,PI. All models were computed using the DHS method and share the same grain populations and porosity (see text). For each row, the images are scaled to the PI image with the maximum value of PI being 100. Neither noise nor instrumental polarization are included in these simulations, highlighting the relative changes in the Uφ and Qφ images with multiple scattering. |
Models based on Mie theory are an attempt to represent the complex, fluffy shapes observed in the dust particles of the interstellar medium. For example, detailed, multiwavelength studies of the optically thin debris disks HD 181327 and HR 4796 A (Lebreton et al. 2012; Milli et al. 2015) show that it is not possible reproduce the observed scattering properties of their dust grains either using solid spheres or DHS. While it is clear that a more elaborate theory is needed to successfully reproduce the scattering properties of the grains, it is noteworthy that both the compact spheres and the DHS methods predict radial polarization features (i.e., negatives in the Qφ image) for several types of grain distributions, and an increment in signal in the Uφ images with multiple scattering.
4. Conclusions
We investigated the conditions for which nonazimuthal polarizations can be produced at significant levels in dusty circumstellar environments, and in particular in young protoplanetary disks. By accomplishing this, we investigated as well the validity of the assumption currently made when reducing PDI data using the radial Stokes parameters, namely that the linear polarization in disks is strictly azimuthal and any nonazimuthal polarization is produced by noise and/or instrumental effects.
Protoplanetary disks are usually optically thick at NIR wavelengths and multiple light scattering alone, or in other words the scattering of polarized light, can readily produce detectable signatures in the Uφ images. These signatures increase with inclination angle and optical thickness, and this trend holds for compact and porous grains. In the disk models discussed above the signal in Uφ can reach up to ~ 4.5% of the PI (unconvolved, peak-to-peak) for a disk inclined by 40°. This value goes up to 50% for an inclination of 70° for the most massive disk shown in Fig. 2. Furthermore, dust properties alone may also lead to violation of the strictly azimuthal linear polarization assumption. Astronomical observations, laboratory measurements, and models indicate that it is quite common in nature to find dust chemical compositions, shapes, and size distributions, which produce azimuthally centrosymmetric polarization for most scattering angles but rotate the polarization plane by 90° for large scattering angles. This produces radial polarization resulting in negative signal in the Qφ images. This is often the case in comets and similarities are found, at least in terms of chemical composition (spectroscopic signatures), between cometary dust and protoplanetary disk dust.
We have demonstrated that genuine astrophysical signal in the Uφ images is expected for a number of very plausible configurations in protoplanetary disks and other circumstellar environments. A detailed analysis of these scenarios and their signatures in the Qφ and Uφ images is beyond the scope of this letter but we stress that caution is in order when assuming that linear polarization is purely azimuthally centrosymmetric in protoplanetary disks, in particular, for disks with inclinations i ≳ 40°. At lower inclinations, our models show that the Uφ images usually contain low signals (at least for the disk models tested here), and it is probably safe to use the radial formalism. If significant signal is found in the Uφ images, the formalism may remain relevant for disk detection experiments, but for quantitative studies (surface brightness, colors, polarization levels) we recommend analyzing the traditional Q and U images as well. On the positive side, signal in the Uφ images, once all instrumental and data-reduction artifacts have been corrected for, implies that there is more information to be extracted regarding the dust population and particle density.
The nomenclature/symbols for these quantities is not standardized. For consistency with previous studies we use the term “radial-Stokes”.
Acknowledgments
We thank the referee for his/her useful comments. We thank M. Min for carefully reading the manuscript. This research was funded by the Millennium Science Initiative, Chilean Ministry of Economy, Nucleus RC130007. H.C. acknowledges support from ALMA/CONICYT (grants 31100025 and 31130027). M.R.S. acknowledges support from FONDECYT grant 1141269. H.A. acknowledges support from FONDECYT 2015 Postdoctoral Grant 3150643. F.M.e. and C.P. acknowledge funding from the EU FP7-2011 under Grant Agreement No. 284405.
References
- Avenhaus, H., Quanz, S. P., Schmid, H. M., et al. 2014, ApJ, 781, 87 [NASA ADS] [CrossRef] [Google Scholar]
- Bastien, P., & Menard, F. 1988, ApJ, 326, 334 [NASA ADS] [CrossRef] [Google Scholar]
- Beuzit, J.-L., Feldt, M., Dohlen, K., et al. 2008, Proc. SPIE, 7014, 18 [Google Scholar]
- Bouwman, J., de Koter, A., Dominik, C., & Waters, L. B. F. M. 2003, A&A, 401, 577 [NASA ADS] [CrossRef] [EDP Sciences] [Google Scholar]
- Canovas, H., Min, M., Jeffers, S. V., Rodenhuis, M., & Keller, C. U. 2012, A&A, 543, A70 [NASA ADS] [CrossRef] [EDP Sciences] [Google Scholar]
- Canovas, H., Ménard, F., Hales, A., et al. 2013, A&A, 556, A123 [NASA ADS] [CrossRef] [EDP Sciences] [Google Scholar]
- Canovas, H., Perez, S., Dougados, C., et al. 2015a, A&A, 578, L1 [NASA ADS] [CrossRef] [EDP Sciences] [Google Scholar]
- Canovas, H., Schreiber, M. R., Cáceres, C., et al. 2015b, ApJ, 805, 21 [NASA ADS] [CrossRef] [Google Scholar]
- Cieza, L. A., Mathews, G. S., Williams, J. P., et al. 2012, ApJ, 752, 75 [NASA ADS] [CrossRef] [Google Scholar]
- Draine, B. T. 2003, ARA&A, 41, 241 [NASA ADS] [CrossRef] [Google Scholar]
- Draine, B. T., & Lee, H. M. 1984, ApJ, 285, 89 [Google Scholar]
- Garufi, A., Quanz, S. P., Avenhaus, H., et al. 2013, A&A, 560, A105 [NASA ADS] [CrossRef] [EDP Sciences] [Google Scholar]
- Hartmann, L., Calvet, N., Gullbring, E., & D’Alessio, P. 1998, ApJ, 495, 385 [NASA ADS] [CrossRef] [Google Scholar]
- Jeffers, S. V., Min, M., Waters, L. B. F. M., et al. 2012, A&A, 539, A56 [NASA ADS] [CrossRef] [EDP Sciences] [Google Scholar]
- Jeffers, S. V., Min, M., Waters, L. B. F. M., et al. 2014, A&A, 572, A3 [NASA ADS] [CrossRef] [EDP Sciences] [Google Scholar]
- Kelley, M. S., Woodward, C. E., Jones, T. J., Reach, W. T., & Johnson, J. 2004, AJ, 127, 2398 [NASA ADS] [CrossRef] [Google Scholar]
- Kirchschlager, F., & Wolf, S. 2014, A&A, 568, A103 [NASA ADS] [CrossRef] [EDP Sciences] [Google Scholar]
- Lebreton, J., Augereau, J.-C., Thi, W.-F., et al. 2012, A&A, 539, A17 [NASA ADS] [CrossRef] [EDP Sciences] [Google Scholar]
- Lenzen, R., Hartung, M., Brandner, W., et al. 2003, Proc. SPIE, 4841, 944 [NASA ADS] [CrossRef] [Google Scholar]
- Li, A., & Greenberg, J. M. 1997, A&A, 323, 566 [NASA ADS] [Google Scholar]
- Macintosh, B. A., Graham, J. R., Palmer, D. W., et al. 2008, Proc. SPIE, 7015, 18 [NASA ADS] [Google Scholar]
- Matsumura, M., & Seki, M. 1996, in Polarimetry of the Interstellar Medium, eds. W. G. Roberge & D. C. B. Whittet, ASP Conf. Ser., 97, 63 [Google Scholar]
- Mie, G. 1908, Ann. Phys. Leipzig, 330, 377 [NASA ADS] [CrossRef] [Google Scholar]
- Milli, J., Mawet, D., Pinte, C., et al. 2015, A&A, 577, A57 [NASA ADS] [CrossRef] [EDP Sciences] [Google Scholar]
- Min, M., Hovenier, J. W., & de Koter, A. 2005, A&A, 432, 909 [NASA ADS] [CrossRef] [EDP Sciences] [Google Scholar]
- Min, M., Canovas, H., Mulders, G. D., & Keller, C. U. 2012, A&A, 537, A75 [NASA ADS] [CrossRef] [EDP Sciences] [Google Scholar]
- Min, M., Jeffers, S. V., Canovas, H., et al. 2013, A&A, 554, A15 [NASA ADS] [CrossRef] [EDP Sciences] [Google Scholar]
- Muñoz, O., Volten, H., de Haan, J. F., Vassen, W., & Hovenier, J. W. 2000, A&A, 360, 777 [NASA ADS] [Google Scholar]
- Muñoz, O., Volten, H., Hovenier, J. W., et al. 2006, A&A, 446, 525 [NASA ADS] [CrossRef] [EDP Sciences] [Google Scholar]
- Murakawa, K. 2010, A&A, 518, A63 [NASA ADS] [CrossRef] [EDP Sciences] [Google Scholar]
- Perrin, M. D., Schneider, G., Duchene, G., et al. 2009, ApJ, 707, L132 [NASA ADS] [CrossRef] [Google Scholar]
- Pinte, C., Ménard, F., Duchêne, G., & Bastien, P. 2006, A&A, 459, 797 [NASA ADS] [CrossRef] [EDP Sciences] [Google Scholar]
- Pinte, C., Harries, T. J., Min, M., et al. 2009, A&A, 498, 967 [NASA ADS] [CrossRef] [EDP Sciences] [Google Scholar]
- Schmid, H. M., Joos, F., & Tschan, D. 2006, A&A, 452, 657 [NASA ADS] [CrossRef] [EDP Sciences] [Google Scholar]
- Siess, L., Dufour, E., & Forestini, M. 2000, A&A, 358, 593 [Google Scholar]
- Tamura, M., Hodapp, K., Takami, H., et al. 2006, Proc. SPIE, 6269, [Google Scholar]
- Volten, H., Muñoz, O., Hovenier, J. W., et al. 2007, A&A, 470, 377 [NASA ADS] [CrossRef] [EDP Sciences] [Google Scholar]
- Wolf, S., Voshchinnikov, N. V., & Henning, T. 2002, A&A, 385, 365 [NASA ADS] [CrossRef] [EDP Sciences] [Google Scholar]
- Woodward, C. E., Jones, T. J., Brown, B., et al. 2011, AJ, 141, 181 [NASA ADS] [CrossRef] [Google Scholar]
All Tables
All Figures
|
Fig. 1 a) Polarizability curves computed at 2.2 μm using solid spheres for amax = 1 mm and different values of amin (see legend). Solid (dashed) lines represent 0% (30%) porous grains. Negative values indicate radial polarization. b) Same as a) using DHS theory with fmax = 0.8. |
| In the text | |
|
Fig. 2 From top to bottom: synthetic images at 2.2 μm for three models (i = 40°) with outer disk masses of Mdust2 = 5 × [10-8,10-5,10-4] M⊙. From left to right, unconvolved Uφ images, and convolved Uφ,Qφ,PI. All models were computed using the DHS method and share the same grain populations and porosity (see text). For each row, the images are scaled to the PI image with the maximum value of PI being 100. Neither noise nor instrumental polarization are included in these simulations, highlighting the relative changes in the Uφ and Qφ images with multiple scattering. |
| In the text | |
Current usage metrics show cumulative count of Article Views (full-text article views including HTML views, PDF and ePub downloads, according to the available data) and Abstracts Views on Vision4Press platform.
Data correspond to usage on the plateform after 2015. The current usage metrics is available 48-96 hours after online publication and is updated daily on week days.
Initial download of the metrics may take a while.