Fig. 3
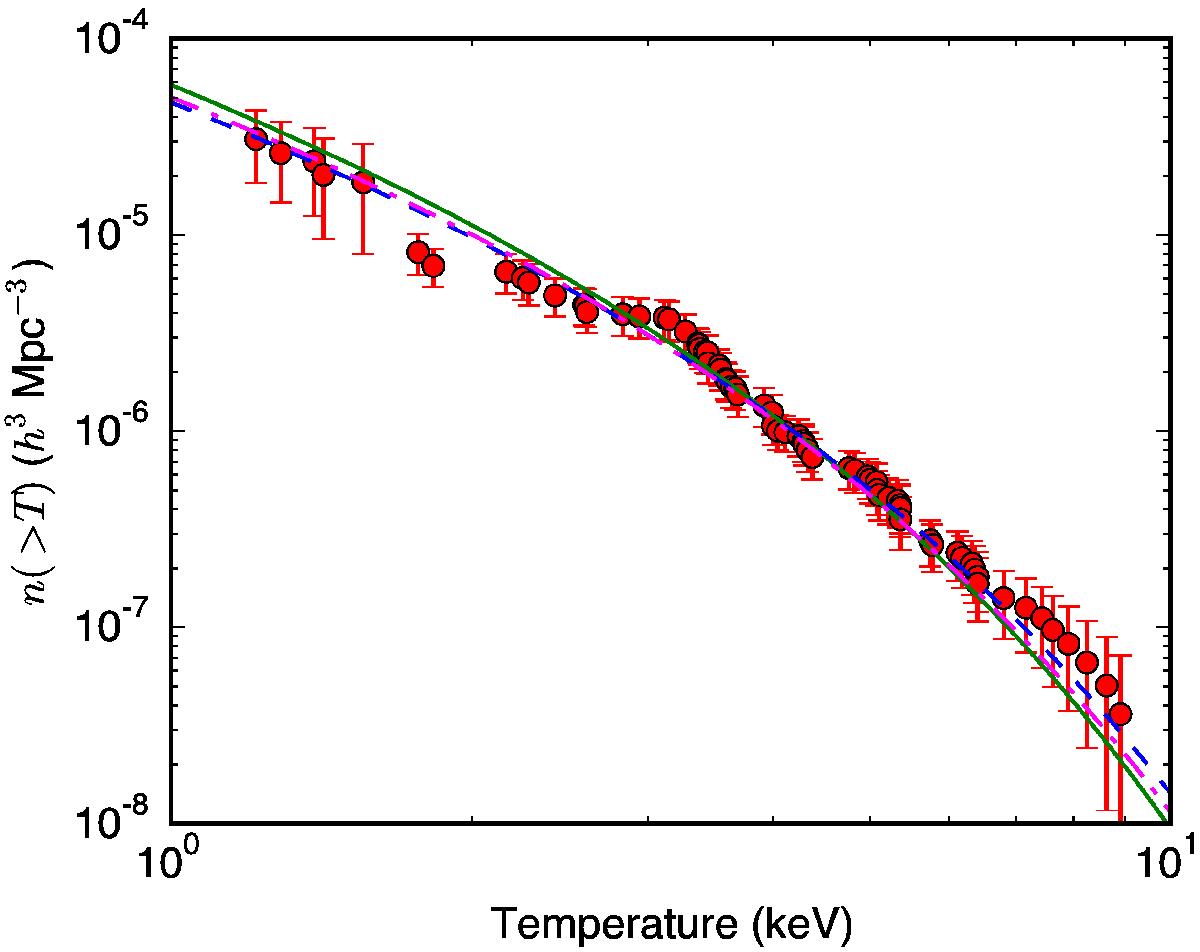
Observed temperature function of local clusters (red dots), with error bars defined as the sum of the inverse-square detection volumes of the clusters. The best-fit theoretical models are also shown, in the case of the mass function of SMT (blue dashed curve), and the mass function of Tinker et al. (2008), with and without a fixed index βTM (defined in Eq. (28)) for the M − T scaling law (solid green and dot-dashed purple curves, respectively).
Current usage metrics show cumulative count of Article Views (full-text article views including HTML views, PDF and ePub downloads, according to the available data) and Abstracts Views on Vision4Press platform.
Data correspond to usage on the plateform after 2015. The current usage metrics is available 48-96 hours after online publication and is updated daily on week days.
Initial download of the metrics may take a while.