Free Access
Fig. 32
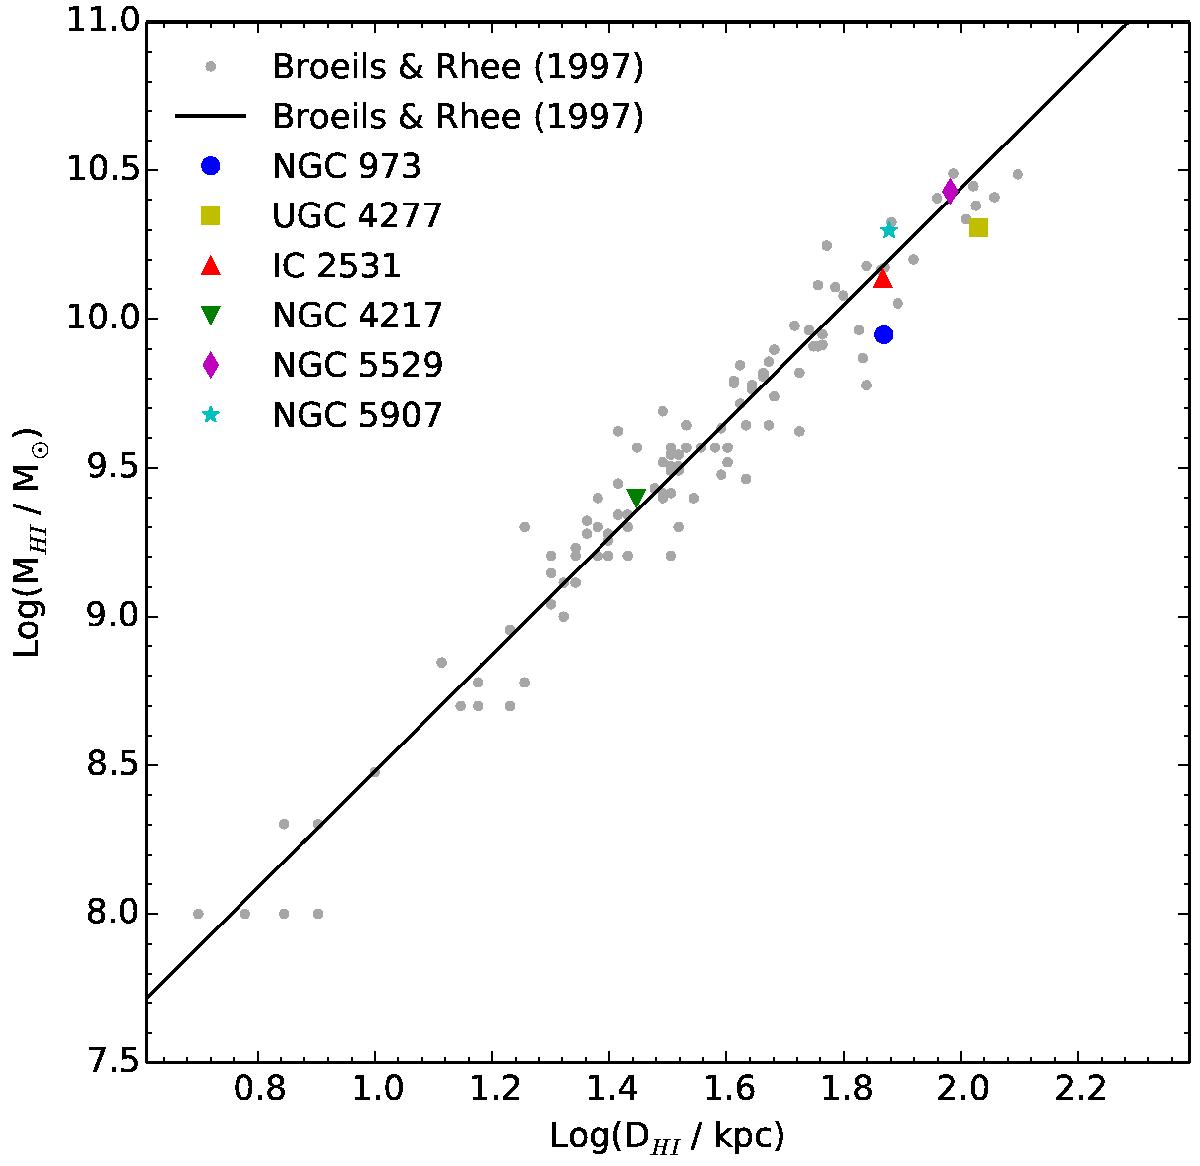
Correlation between the total H i mass and the diameter of the H i disk for our sample (coloured symbols) and the sample of Broeils & Rhee (1997; grey dots, based on their Table 1). The black line shows the best fit linear relation from Broeils & Rhee (1997).
Current usage metrics show cumulative count of Article Views (full-text article views including HTML views, PDF and ePub downloads, according to the available data) and Abstracts Views on Vision4Press platform.
Data correspond to usage on the plateform after 2015. The current usage metrics is available 48-96 hours after online publication and is updated daily on week days.
Initial download of the metrics may take a while.