Fig. 3
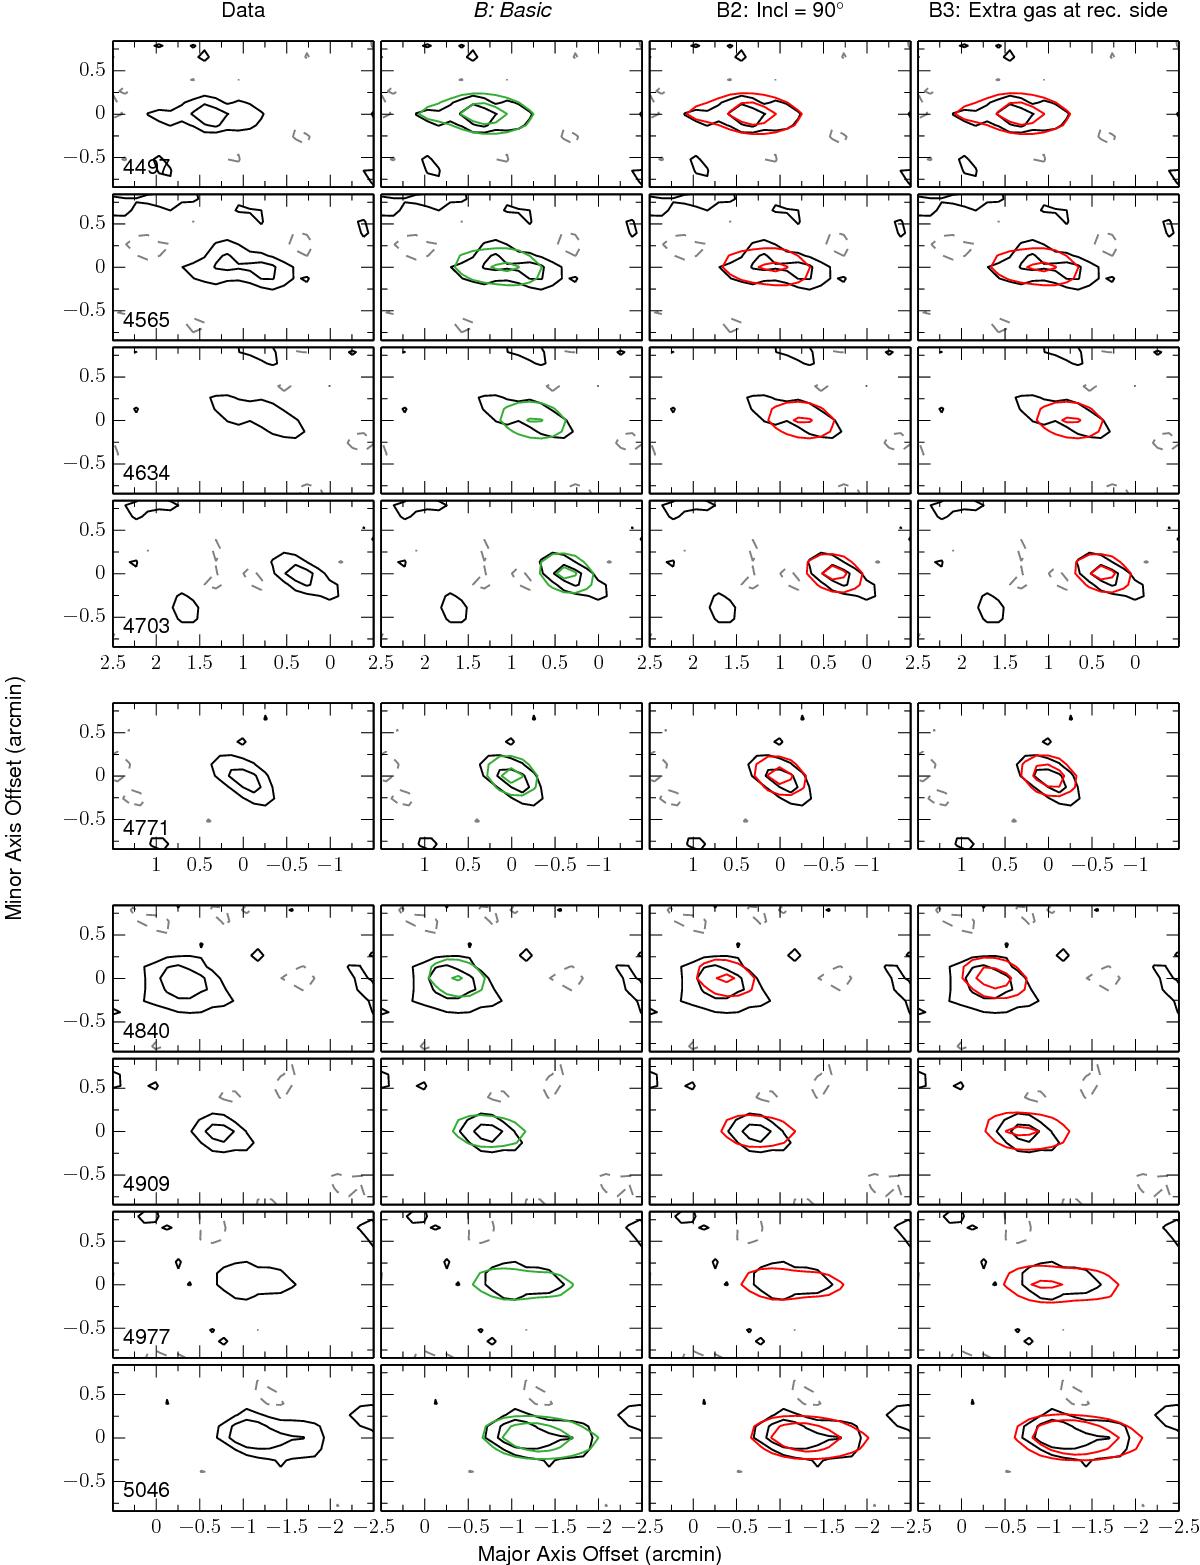
Representative channel maps from the observed data cube of NGC 973 and the various models. Contour levels are −2.3, 2.3 (1.5σ), and 6.2 mJy beam-1. The observations are shown as black contours with the negative contours as dashed grey. The green contours show the final (B) model. Other models are shown as red contours. The line-of-sight velocity is indicated in km s-1 in the bottom left corner of the first panel of each row. The systemic velocity is 4770 ± 8 km s-1. The horizontal axis is slightly shifted between the three blocks composing the figure.
Current usage metrics show cumulative count of Article Views (full-text article views including HTML views, PDF and ePub downloads, according to the available data) and Abstracts Views on Vision4Press platform.
Data correspond to usage on the plateform after 2015. The current usage metrics is available 48-96 hours after online publication and is updated daily on week days.
Initial download of the metrics may take a while.