Fig. 27
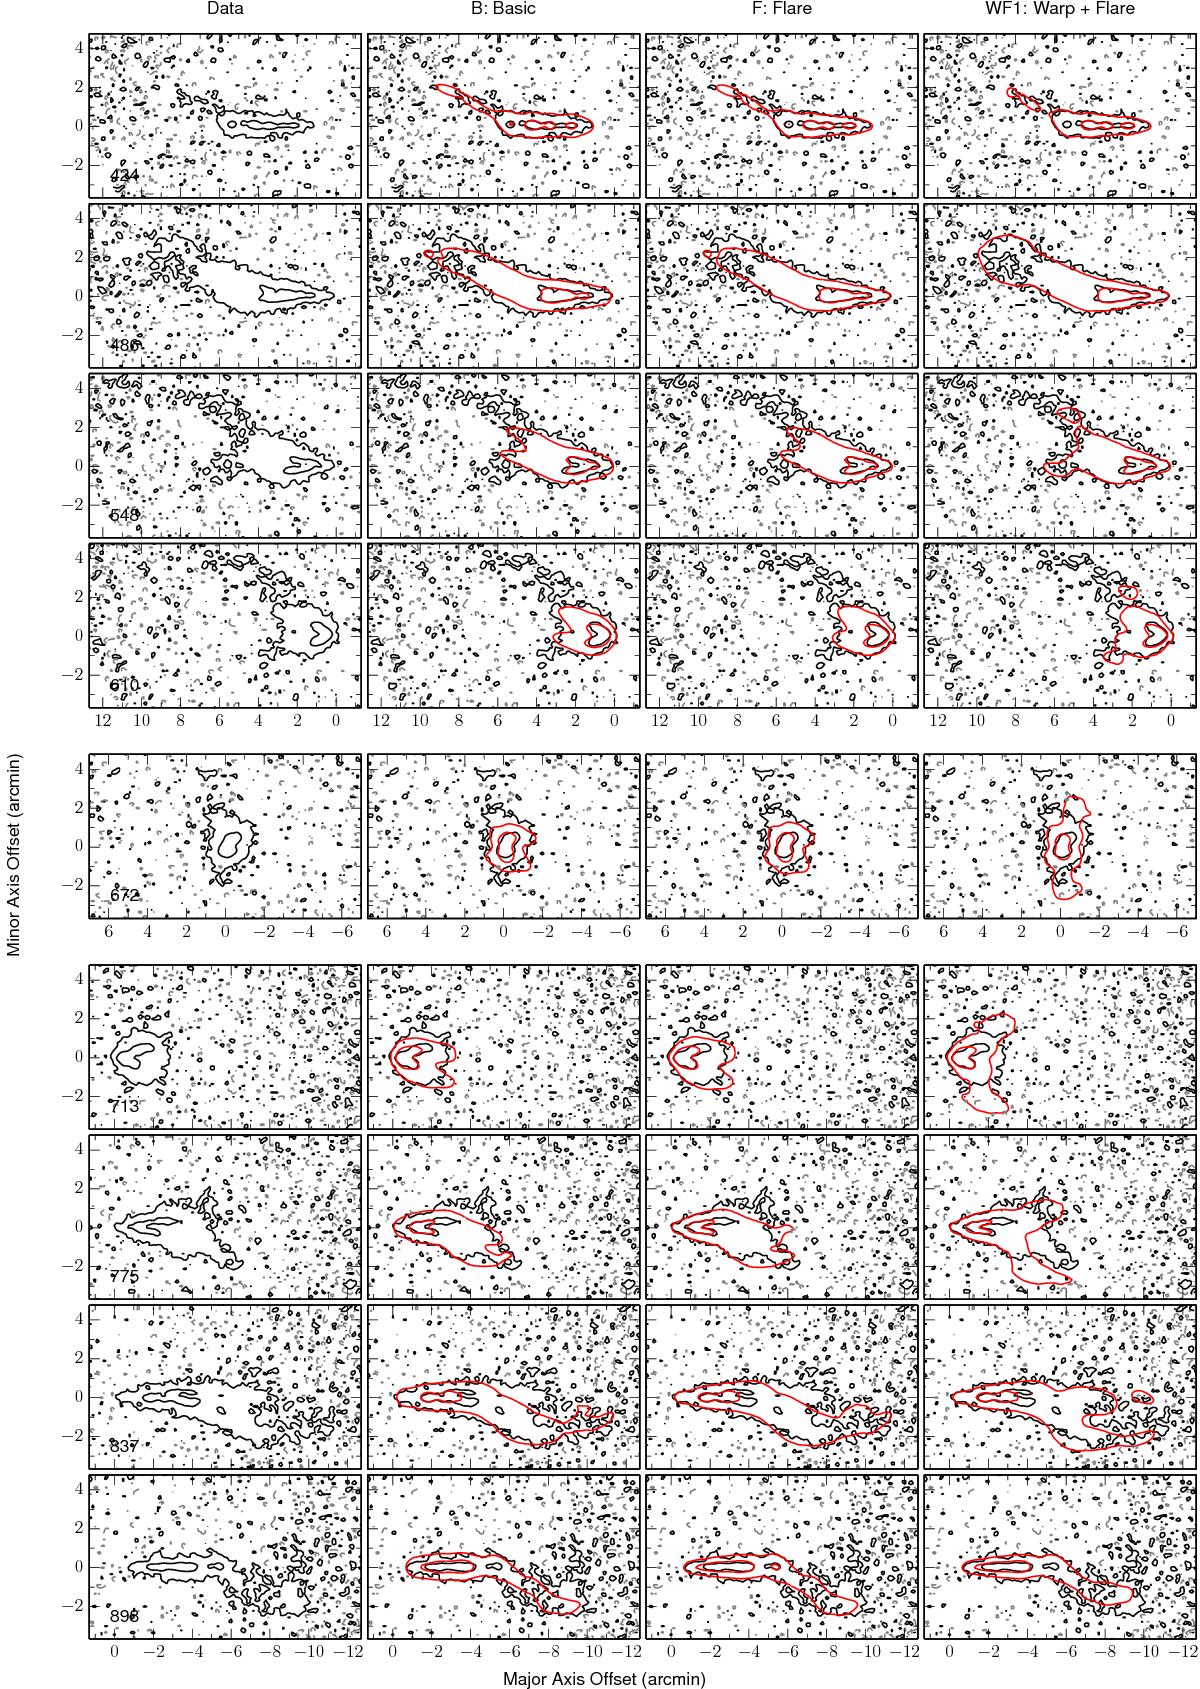
Representative channel maps from the observed data cube of NGC 5907 and the various models. Contour levels are −0.5, 0.5 (1.5σ), and 6.4 mJy beam-1. The black contours show the observations with negative contours as dashed grey. The red contours represent the models. The systemic velocity is 664 ± 7 km s-1.
Current usage metrics show cumulative count of Article Views (full-text article views including HTML views, PDF and ePub downloads, according to the available data) and Abstracts Views on Vision4Press platform.
Data correspond to usage on the plateform after 2015. The current usage metrics is available 48-96 hours after online publication and is updated daily on week days.
Initial download of the metrics may take a while.