Fig. 24
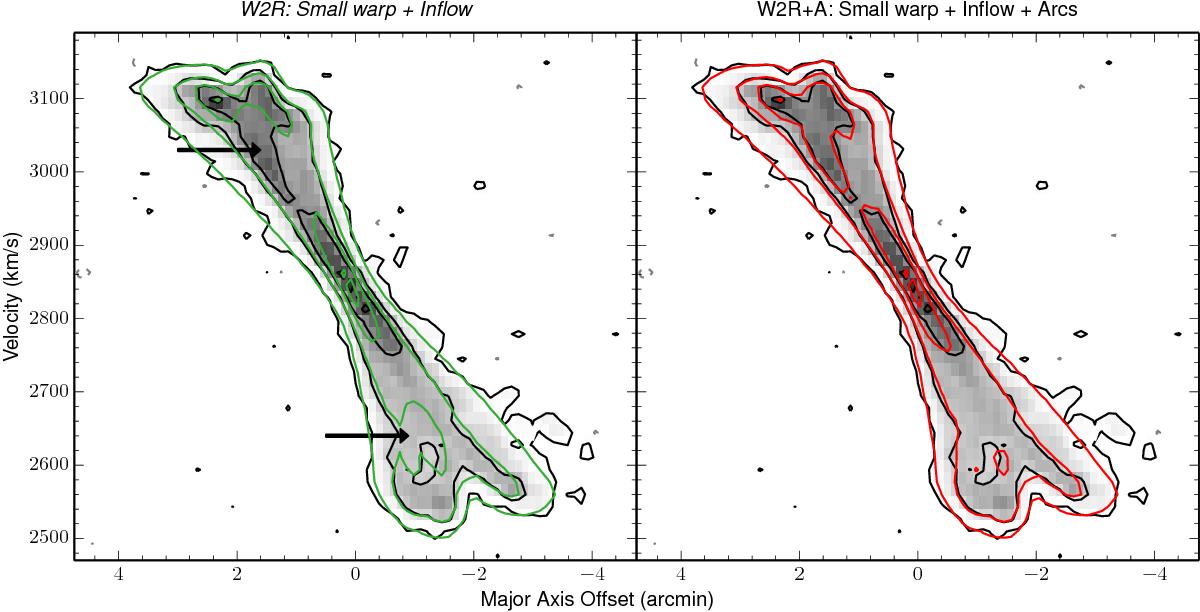
Observed major axis position-velocity diagram of NGC 5529 (black and grey contours) overlaid with different models. The green contours show the final W2R model, the red contours show the W2R+A model. Contour levels are −0.8, 0.8 (1.5σ), 5.6, 11.2 and 16.8 mJy beam-1. The greyscale corresponds to the observations. The arrows indicate a H i ridge that is not reproduced by the W2R model.
Current usage metrics show cumulative count of Article Views (full-text article views including HTML views, PDF and ePub downloads, according to the available data) and Abstracts Views on Vision4Press platform.
Data correspond to usage on the plateform after 2015. The current usage metrics is available 48-96 hours after online publication and is updated daily on week days.
Initial download of the metrics may take a while.