Fig. 20
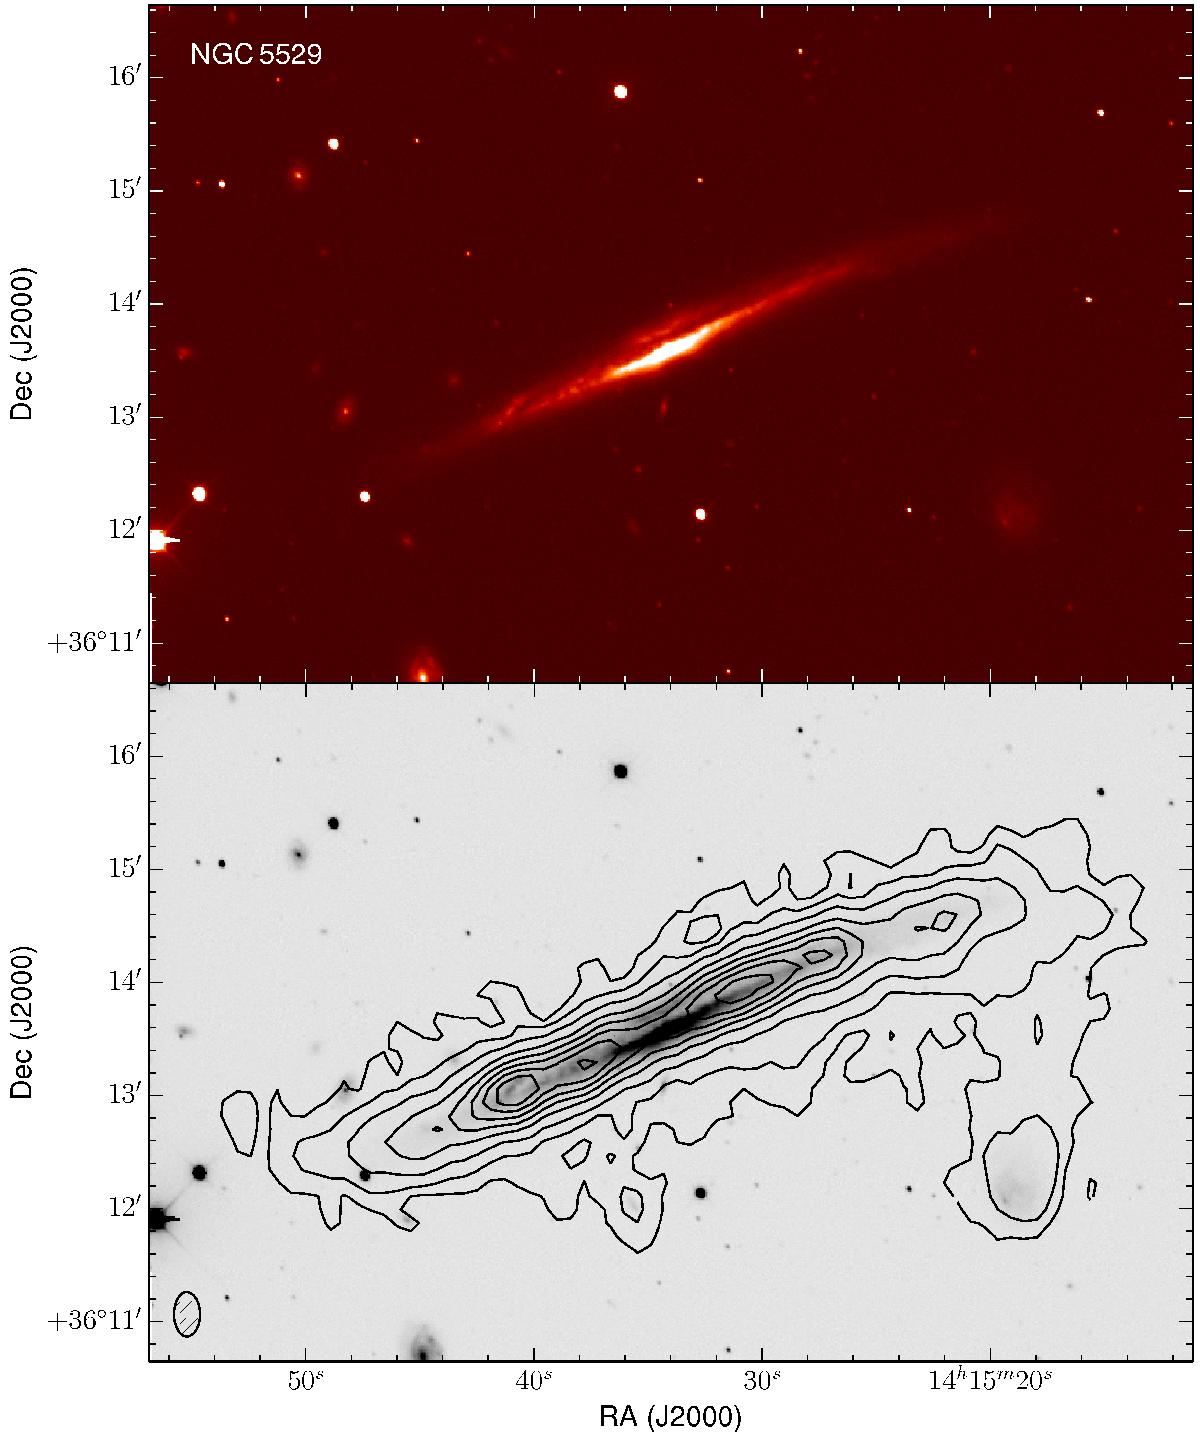
Top: false colour V-band image of NGC 5529 taken with the 1.3 m telescope at the Skinakas Observatory in Crete. The data were cleaned and combined using standard data reduction techniques. Bottom: H i contours overlaid on the same V-band image. Contours start at 9.94 × 10¹⁹ atoms cm-2 and increase as 4, 10, 20, 30, 40, 50, and 60 times this value. North is up, east to the left.
Current usage metrics show cumulative count of Article Views (full-text article views including HTML views, PDF and ePub downloads, according to the available data) and Abstracts Views on Vision4Press platform.
Data correspond to usage on the plateform after 2015. The current usage metrics is available 48-96 hours after online publication and is updated daily on week days.
Initial download of the metrics may take a while.