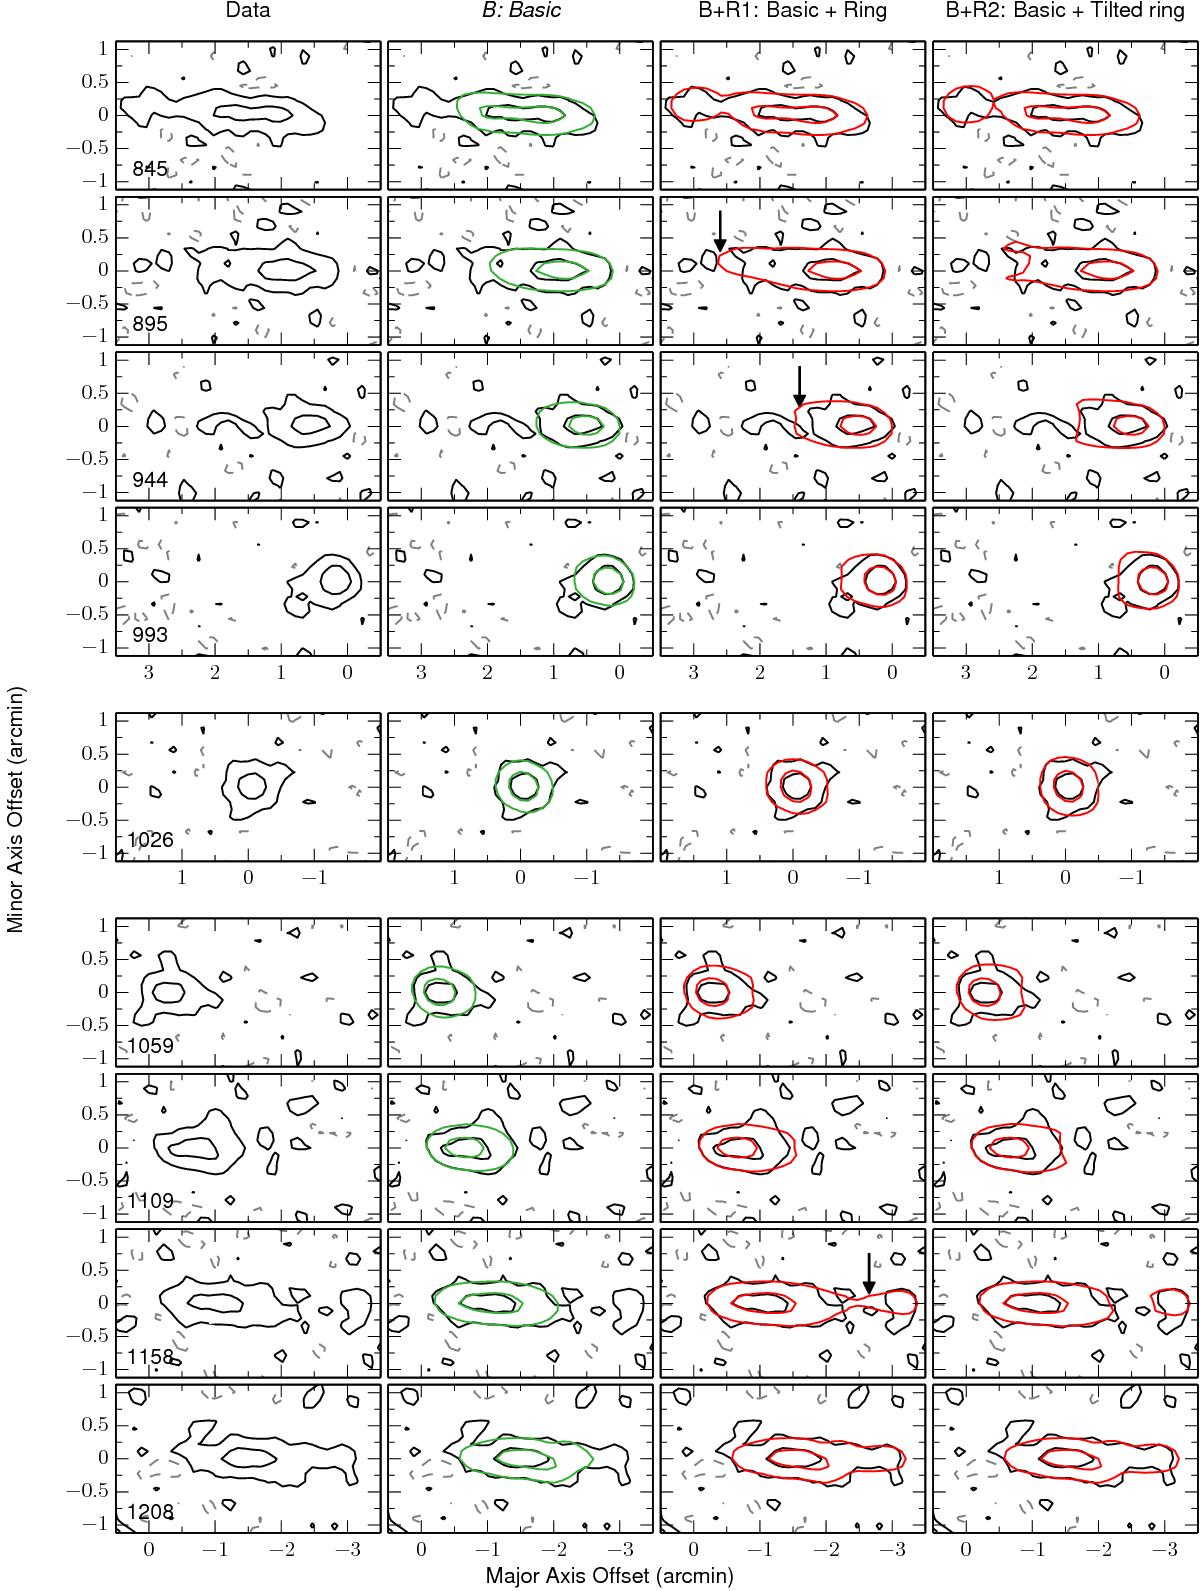
Fig. 19

Representative channel maps from the observed data cube of NGC 4217 and the different models that include the outer ring. Contour levels are −1.5, 1.5 (1.5σ), and 8.0 mJy beam-1. The black contours show the observations, with negative contours as dashed grey. The green contours represent the final (B) model. Other models are shown as red contours. Because we want to highlight different features, the channels shown here are different from those in Fig. 17. The arrows highlight the projection along the major axis of the outer ring in the B+R1 model, which clearly disagrees with the data.
Current usage metrics show cumulative count of Article Views (full-text article views including HTML views, PDF and ePub downloads, according to the available data) and Abstracts Views on Vision4Press platform.
Data correspond to usage on the plateform after 2015. The current usage metrics is available 48-96 hours after online publication and is updated daily on week days.
Initial download of the metrics may take a while.


