Free Access
Fig. 14
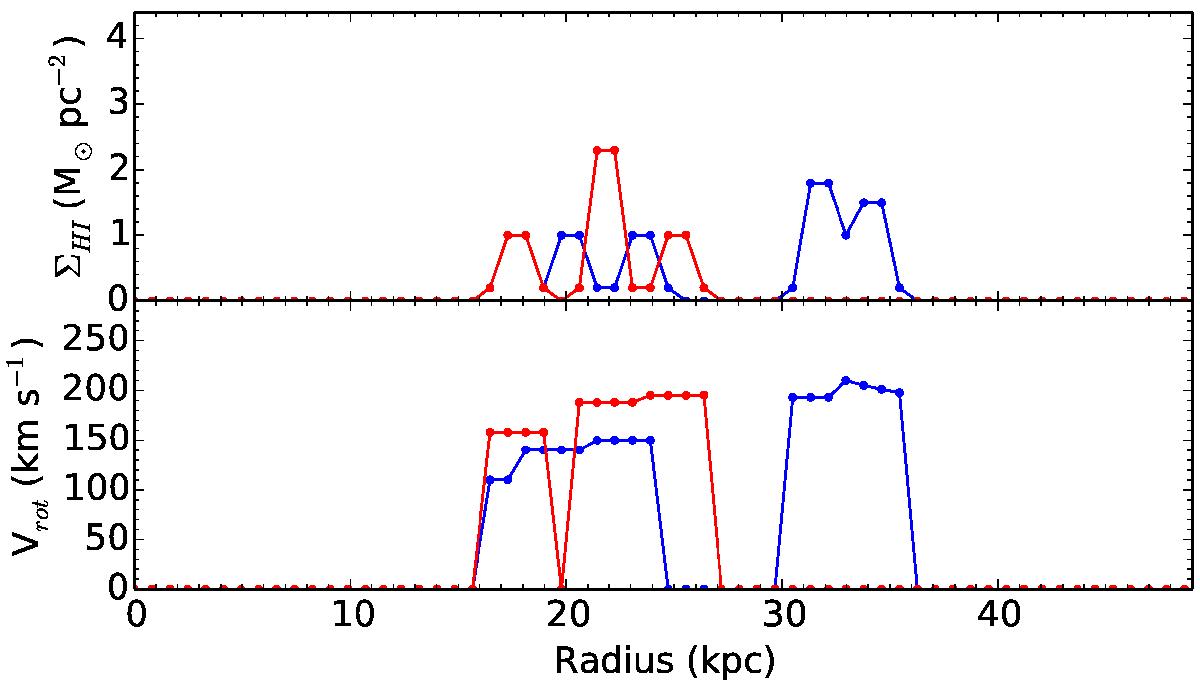
Surface densities (top) and rotational velocities (bottom) of the rings added to the W model of IC 2531 in order to reproduce the high-density ridge in the major axis XV-diagram. Blue indicates the approaching side, red the receding side.
Current usage metrics show cumulative count of Article Views (full-text article views including HTML views, PDF and ePub downloads, according to the available data) and Abstracts Views on Vision4Press platform.
Data correspond to usage on the plateform after 2015. The current usage metrics is available 48-96 hours after online publication and is updated daily on week days.
Initial download of the metrics may take a while.