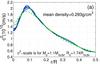
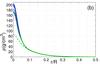
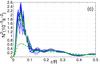
Fig. 7
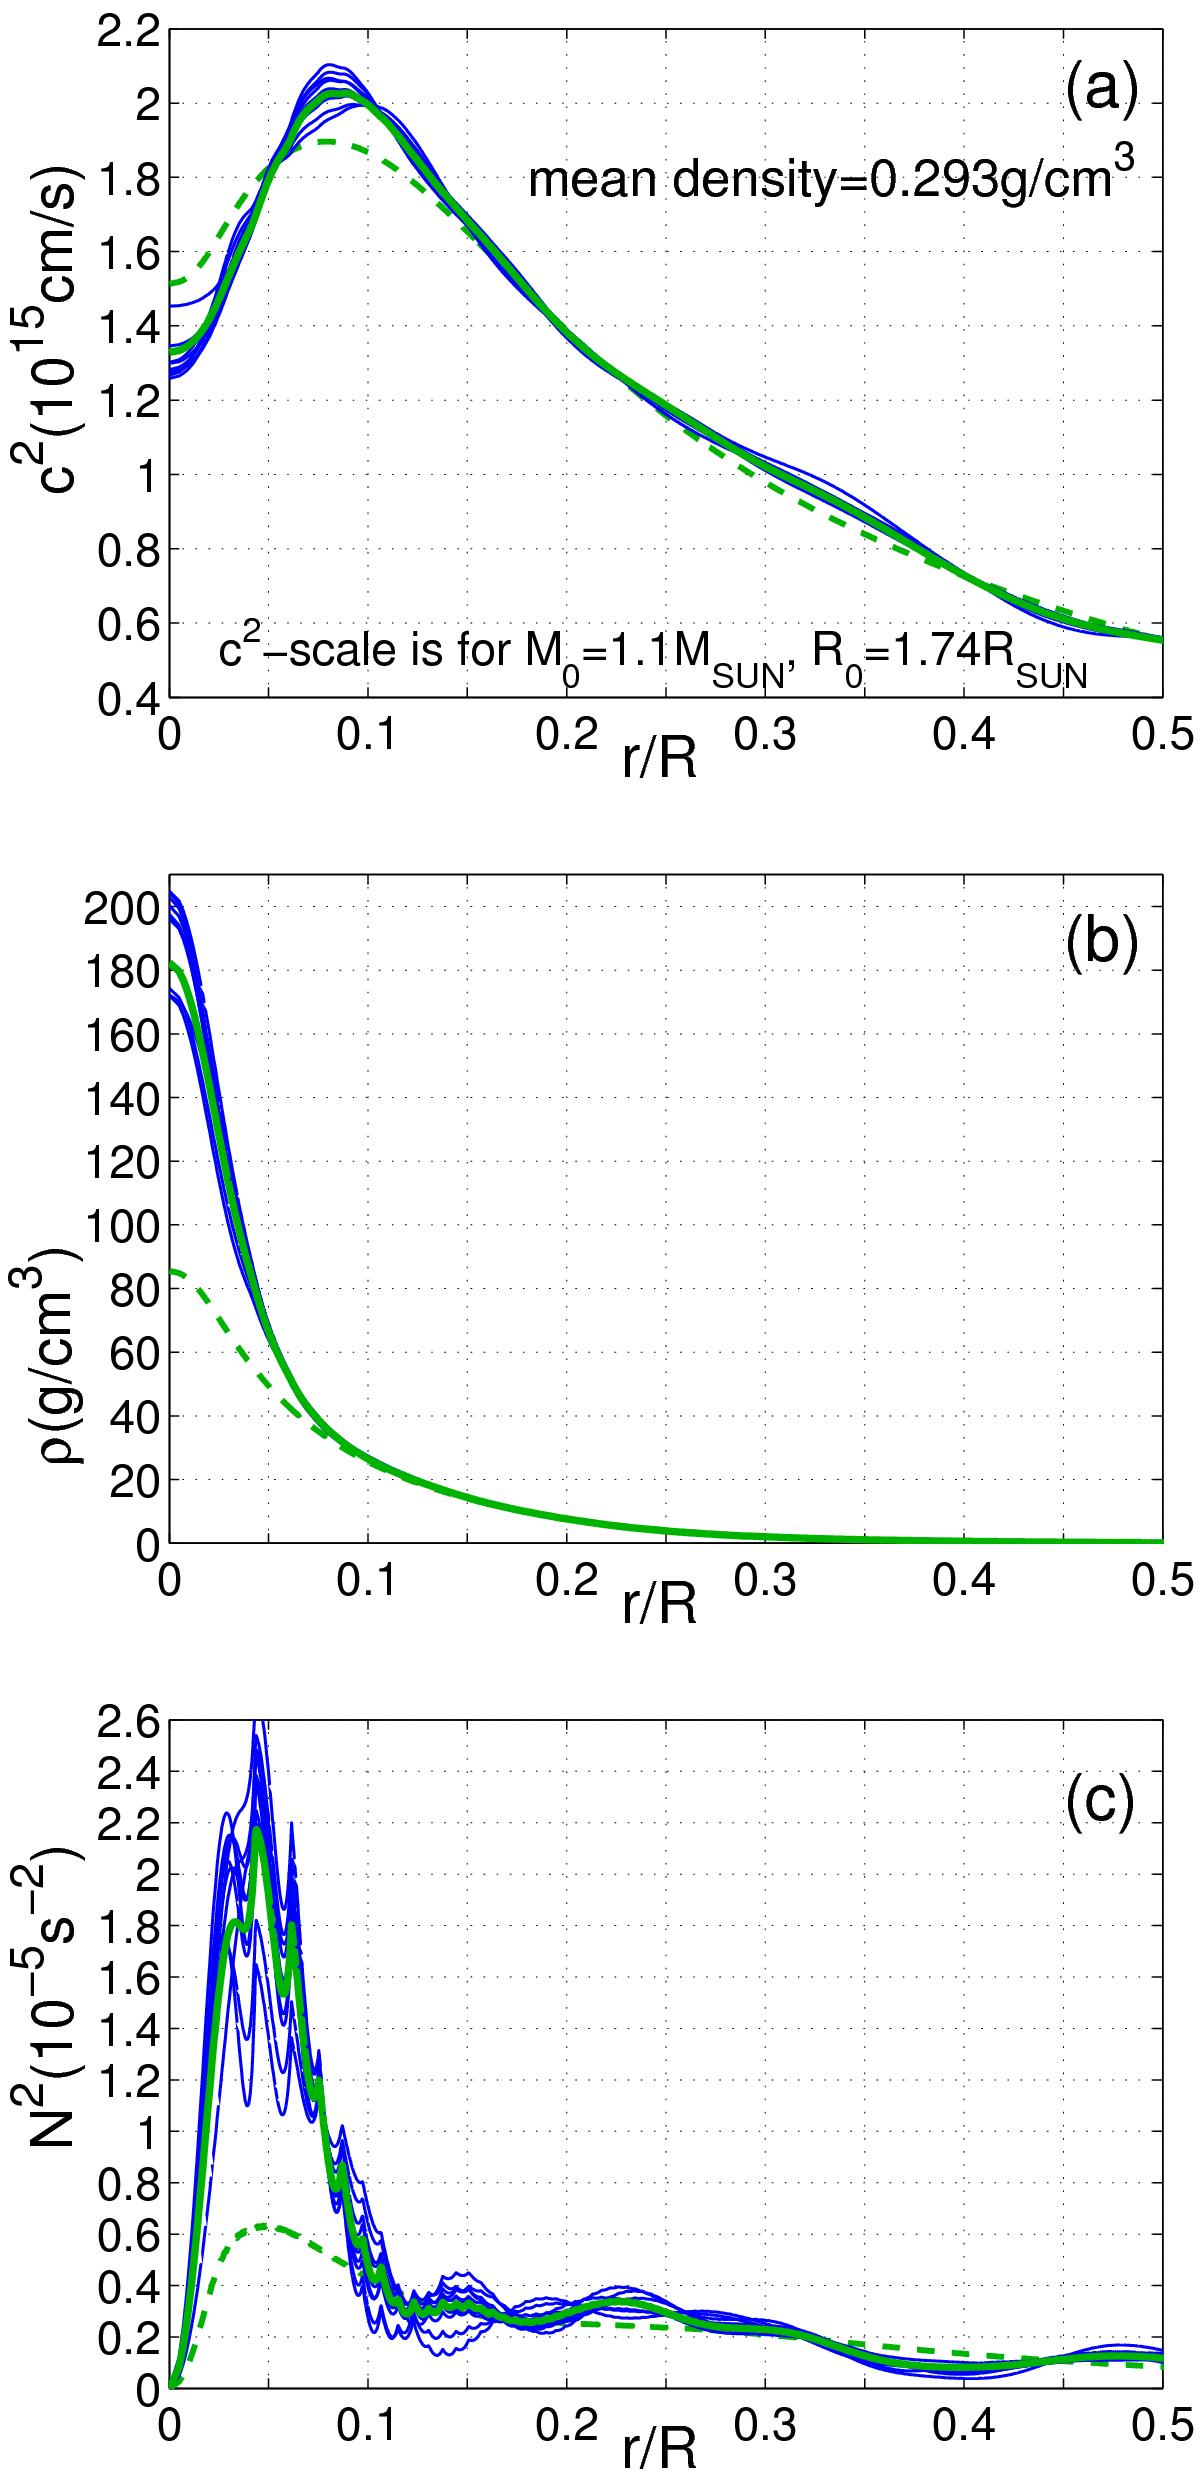
Structural inversion for Star A: the sound speed a), density b), and buoyancy frequency c). Dashed green lines show a (re-scaled) model taken as an initial guess; solid green lines display the inverted result. Thin blue lines result from adding the measured frequencies with Gaussian noise, of variance corresponding to the reported uncertainties, in 10 realisations, to address the sensitivity of the inversion to random errors in the input data.
Current usage metrics show cumulative count of Article Views (full-text article views including HTML views, PDF and ePub downloads, according to the available data) and Abstracts Views on Vision4Press platform.
Data correspond to usage on the plateform after 2015. The current usage metrics is available 48-96 hours after online publication and is updated daily on week days.
Initial download of the metrics may take a while.