Fig. 9
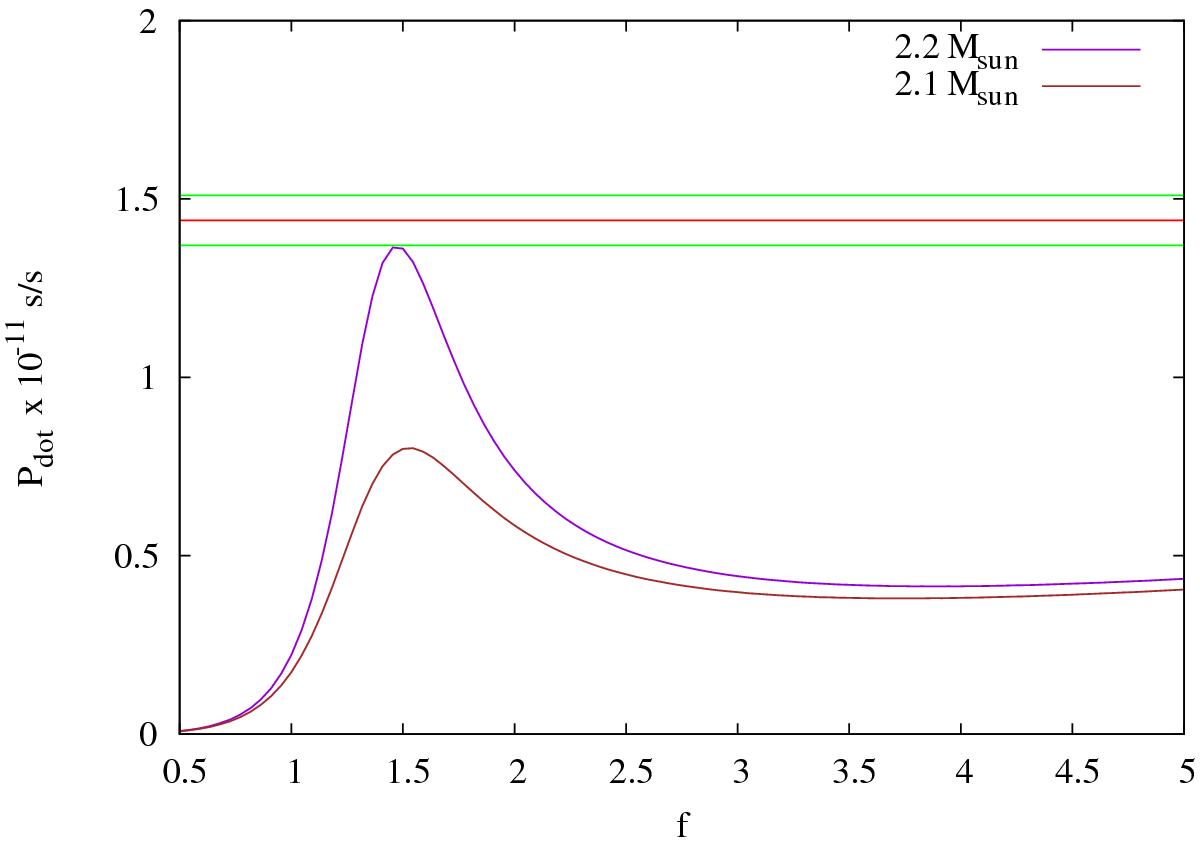
Orbital period derivative of XB 1916-053 in units of 10-11 s s-1 versus the thermal bloating factor f of the companion star. The brown and purple curves are obtained using a NS mass of 2.1 and 2.2 M⊙. The red and green lines indicate the best-fit value and the values at 68% confidence level of the orbital period derivative obtained from the LQS ephemeris. The purple curve is compatible at 1σ with the measured orbital period derivative for f ≃ 1.5.
Current usage metrics show cumulative count of Article Views (full-text article views including HTML views, PDF and ePub downloads, according to the available data) and Abstracts Views on Vision4Press platform.
Data correspond to usage on the plateform after 2015. The current usage metrics is available 48-96 hours after online publication and is updated daily on week days.
Initial download of the metrics may take a while.