Fig. 3
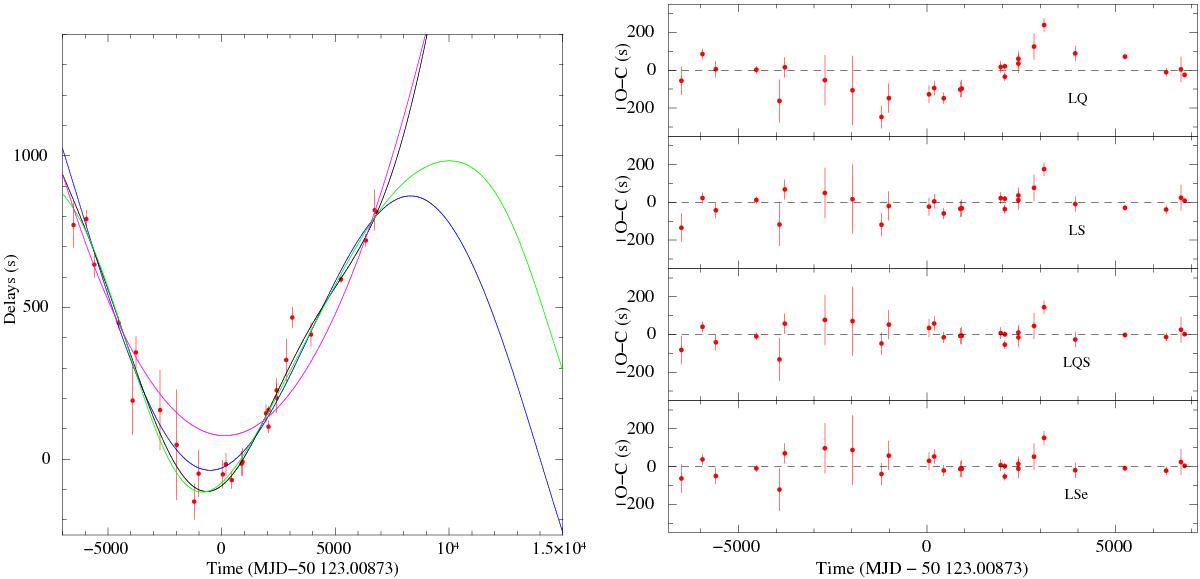
Left panel: dips’s arrival time delays versus time. The magenta, blue, black , and green curves are the best-fit curves obtained using the linear+quadratic (LQ), linear+sinusoidal (LS), linear+quadratic+sinusoidal (LQS), and linear+sinusoidal function taking into account a possible eccentricity (LSe), respectively. Right panel: observed minus calculated delays in units of seconds. The residuals, from the top to the bottom, correspond to the LQC, LS, LQS, and LSe function, respectively.
Current usage metrics show cumulative count of Article Views (full-text article views including HTML views, PDF and ePub downloads, according to the available data) and Abstracts Views on Vision4Press platform.
Data correspond to usage on the plateform after 2015. The current usage metrics is available 48-96 hours after online publication and is updated daily on week days.
Initial download of the metrics may take a while.