Fig. 15
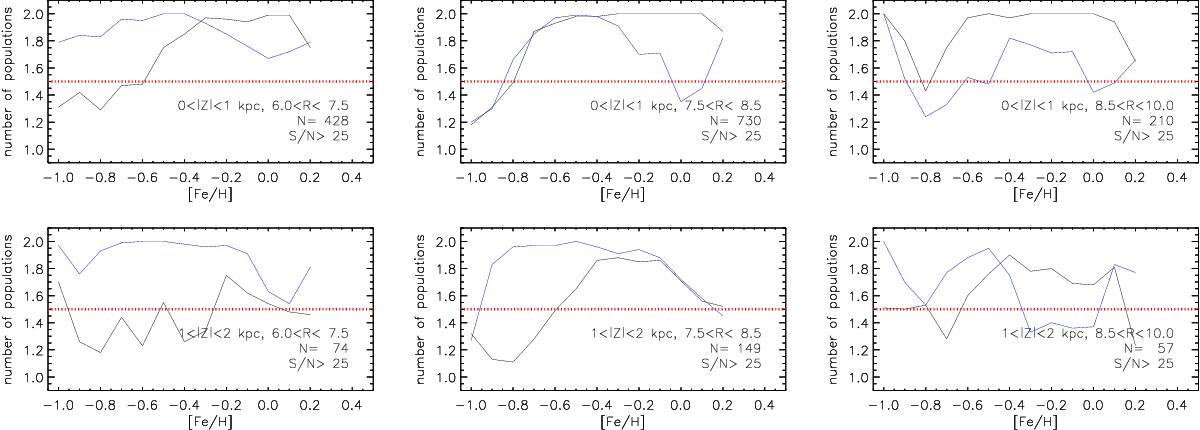
Number of required populations, averaged over 100 Monte-Carlo realisations, as a function of metallicity. For each realisation, the significance of the χ2-distribution is evaluated, and the likelihood of requiring one or two populations is evaluated. Blue (black) line represents the results for the low-α (high-α) population. A value larger than 1.5 indicates that the low-α (high-α) population alone cannot describe the observed trends.
Current usage metrics show cumulative count of Article Views (full-text article views including HTML views, PDF and ePub downloads, according to the available data) and Abstracts Views on Vision4Press platform.
Data correspond to usage on the plateform after 2015. The current usage metrics is available 48-96 hours after online publication and is updated daily on week days.
Initial download of the metrics may take a while.