Fig. 12
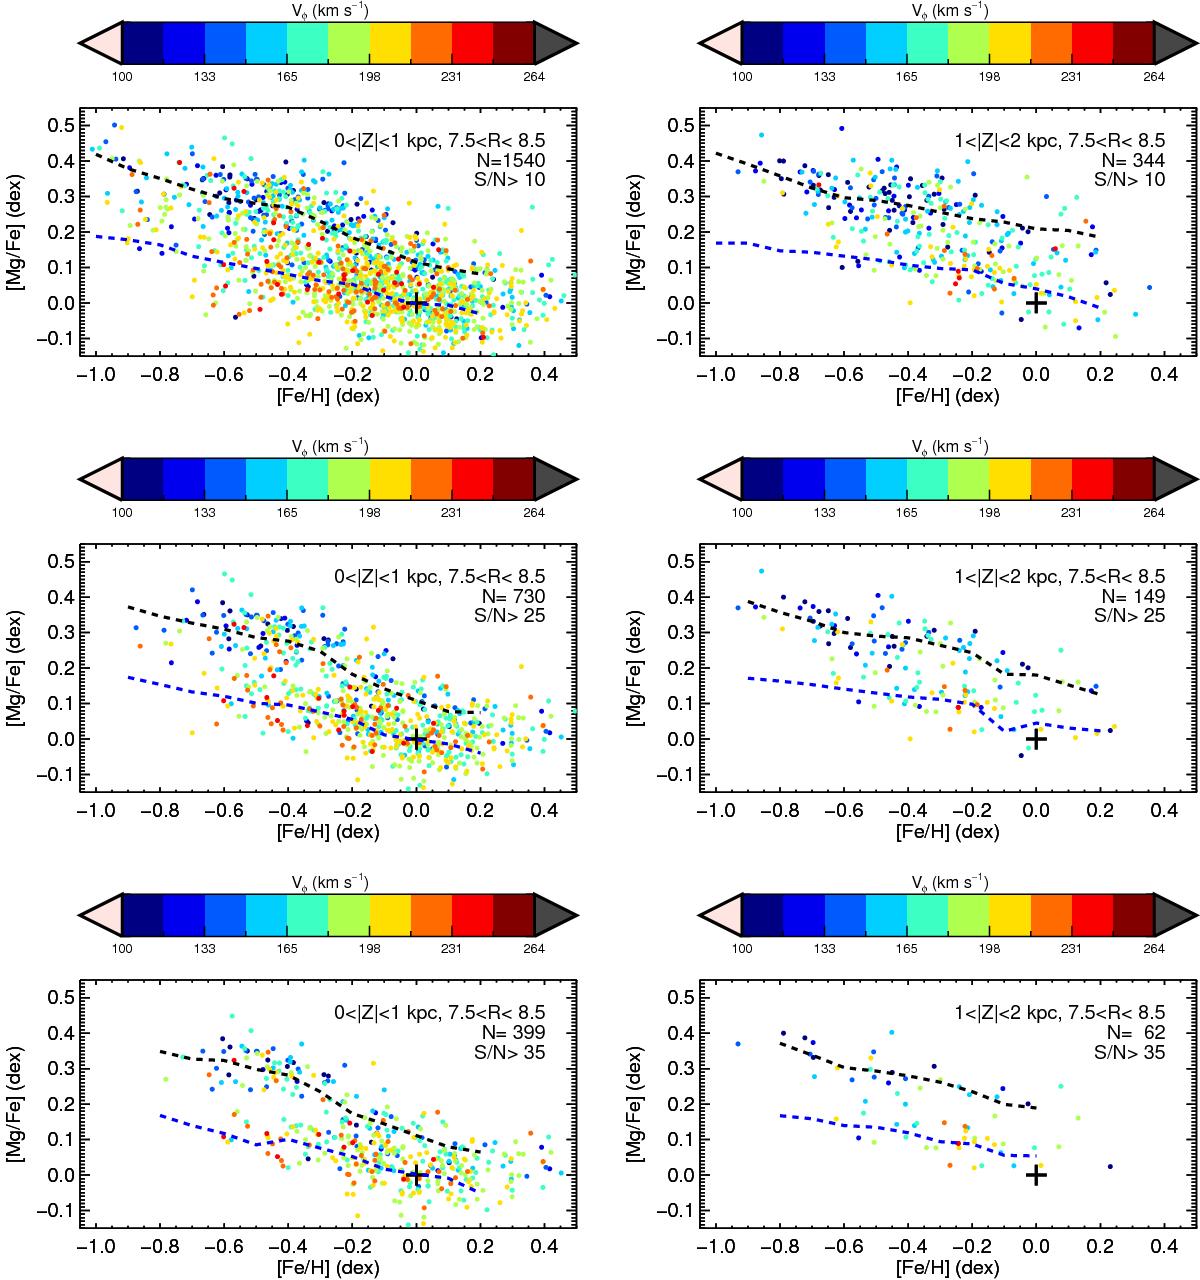
[Mg/Fe] as a function of [Fe/H] for the stars in the solar neighbourhood, closer than 1 kpc from the Galactic plane (left panels) and between 1 kpc and 2 kpc from the plane (right panels). Different selections, according to the signal-to-noise ratio of the spectra, are shown at the top (S/N> 10) and the bottom (S/N> 35). The colour-code corresponds to the azimuthal velocity of the stars. The dashed blue (black) line corresponds to the best-fit model of the thick (thin) disc. The black “+” sign is located at [Mg/Fe] = 0 and [Fe/H] = 0 dex.
Current usage metrics show cumulative count of Article Views (full-text article views including HTML views, PDF and ePub downloads, according to the available data) and Abstracts Views on Vision4Press platform.
Data correspond to usage on the plateform after 2015. The current usage metrics is available 48-96 hours after online publication and is updated daily on week days.
Initial download of the metrics may take a while.