Fig. 10
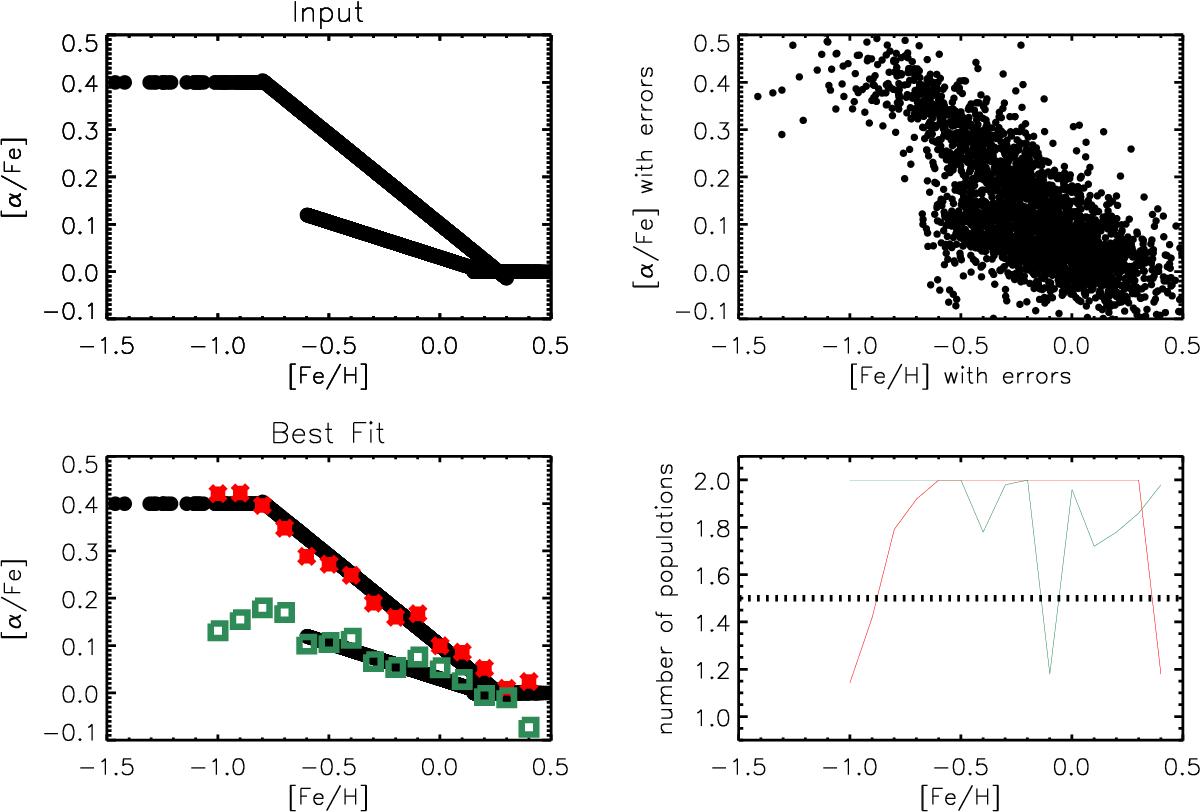
Top: adopted trends for the mock data used to test our fitting procedure (left) and effect on the mock data of introducing errors in [Fe/H] and [α/ Fe] as the observations (right). Bottom: output of our fitting procedure for the high-α (red crosses) and low-α (green squares) populations performed on the noisy mock data. Over-plotted in black are the error-free points used to create the mock catalogue. The bottom right plot shows the average of the number of populations needed to better fit the data based on the log-likelihood ratio tests of Eq. (6). When the red (green) line is below 1.5, this indicates that fitting the data with only a thick (thin) disc rather than two components simultaneously is more significant for more than half of the Monte-Carlo realisations.
Current usage metrics show cumulative count of Article Views (full-text article views including HTML views, PDF and ePub downloads, according to the available data) and Abstracts Views on Vision4Press platform.
Data correspond to usage on the plateform after 2015. The current usage metrics is available 48-96 hours after online publication and is updated daily on week days.
Initial download of the metrics may take a while.