Fig. 7
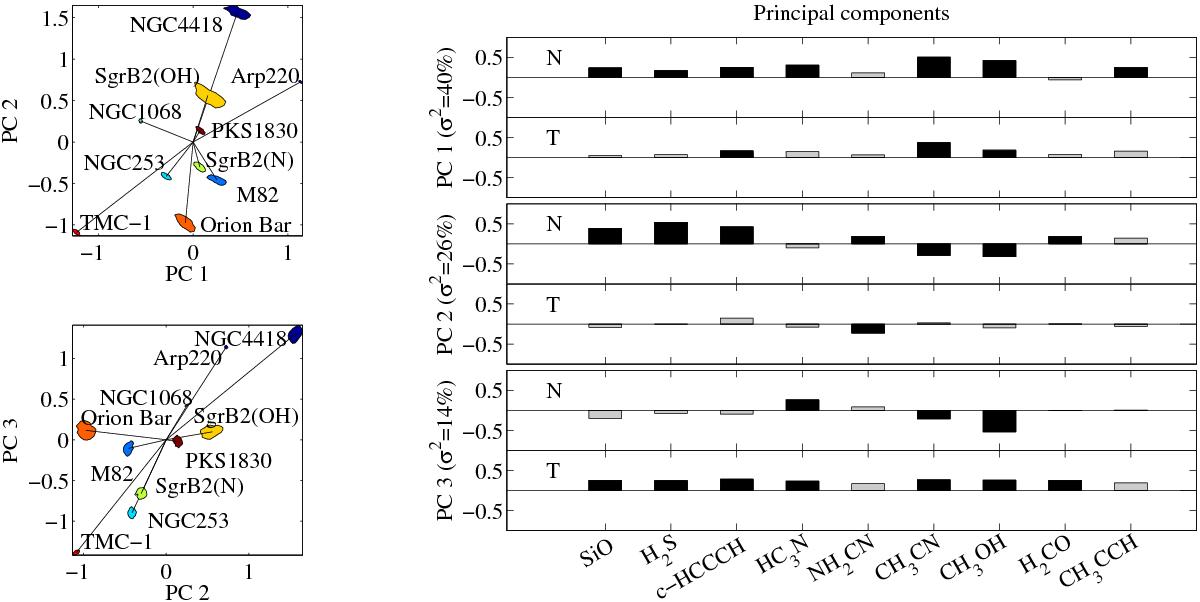
Principal component analysis of molecular abundances. Left: projection of the molecular abundances of Fig. 6 onto the first three principal components (PC). For each source, the 1σ confidence interval is shown as a shaded area. The color legend is the same as in Fig. 6. Right: relative contribution of molecular abundances and kinetic temperatures to the first three principal components. For each PC, the upper and lower panels show contributions from abundance and temperature, respectively. The variables contributing for up to 75% in total to each PC are highlighted in black. The fraction of the total variance (σ2) represented by each PC is shown in parentheses.
Current usage metrics show cumulative count of Article Views (full-text article views including HTML views, PDF and ePub downloads, according to the available data) and Abstracts Views on Vision4Press platform.
Data correspond to usage on the plateform after 2015. The current usage metrics is available 48-96 hours after online publication and is updated daily on week days.
Initial download of the metrics may take a while.