Fig. 9
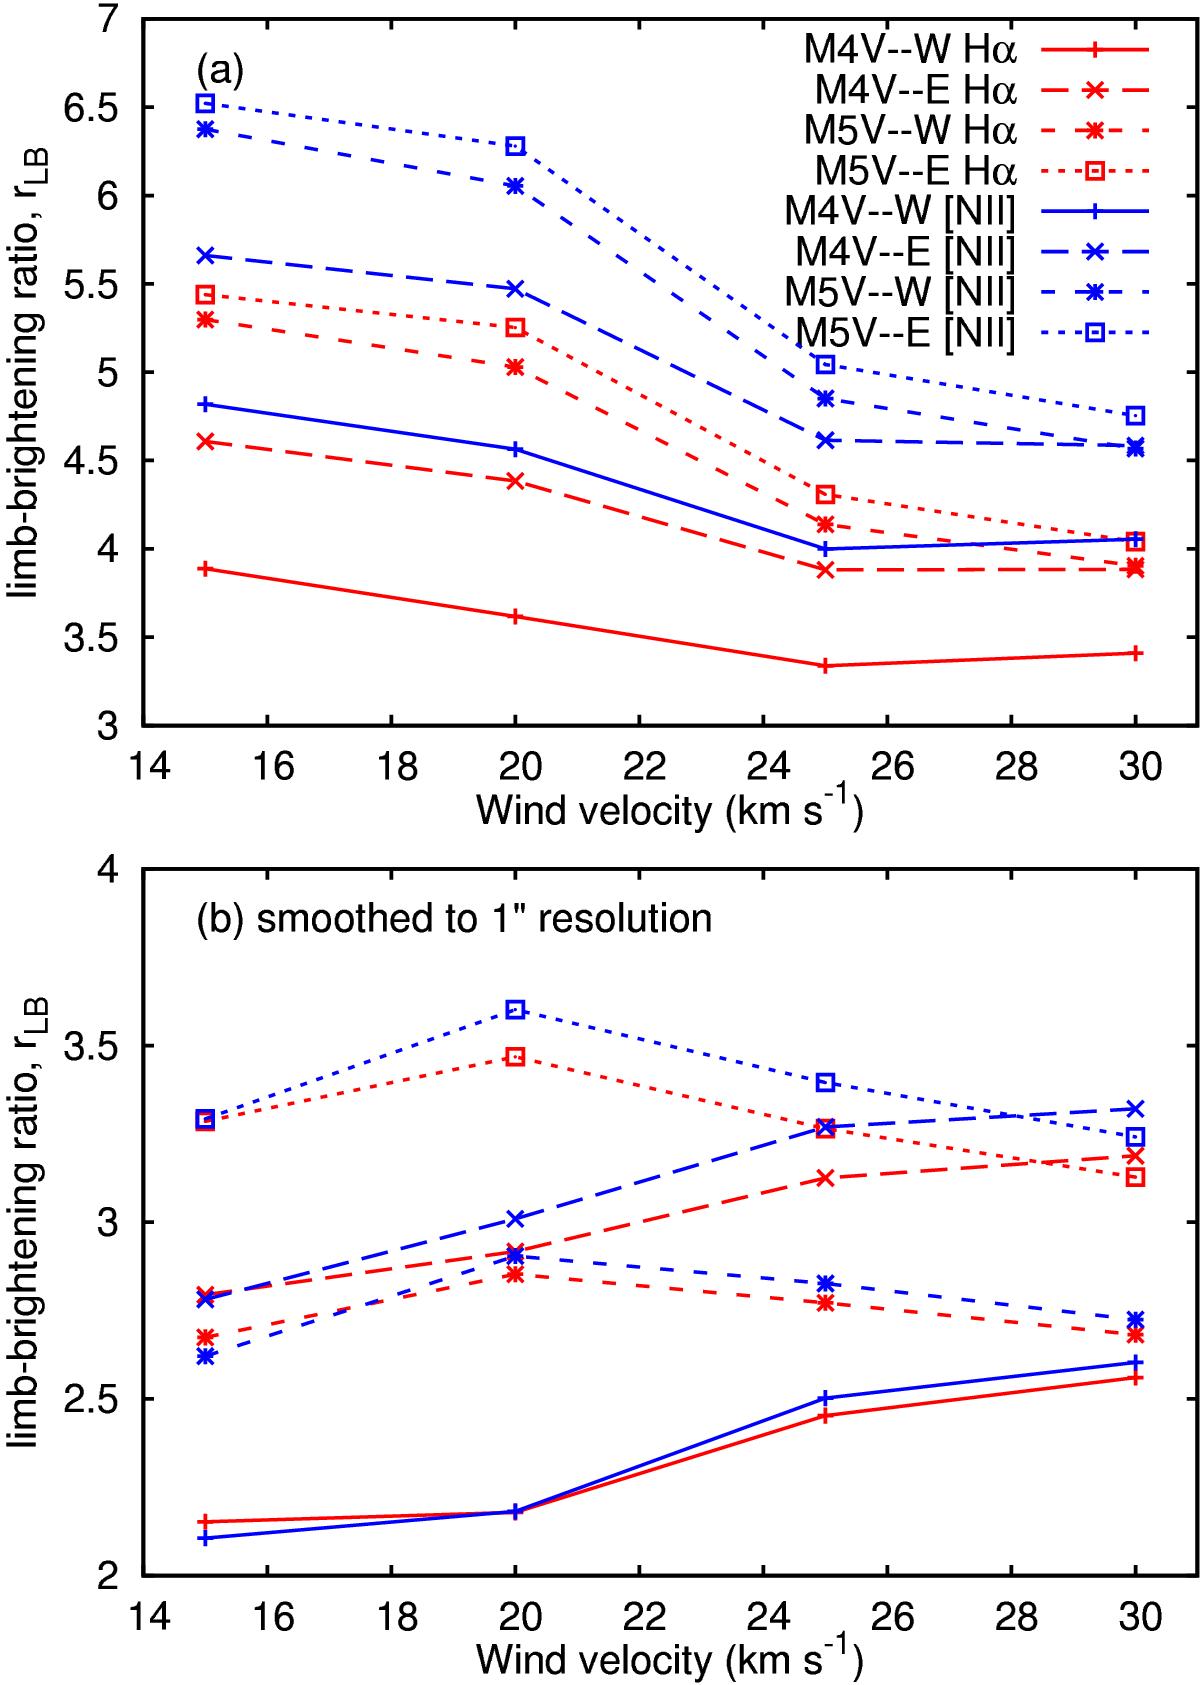
Comparison between wind velocity, v∞, and the degree of limb brightening of the Hα and [N II] spectral lines, defined as the ratio of the peak brightness to that at lines of sight near the star (r = 0). The boundary between D-type and R-type ionization fronts is at v∞ ≈ 22 km s-1. The red lines are for Hα and the blue for [N II]. Panel a) shows the raw simulation data, and panel b) when smoothed to a spatial resolution of 1 arcsec. The lines in panel b) follow the legend in panel a).
Current usage metrics show cumulative count of Article Views (full-text article views including HTML views, PDF and ePub downloads, according to the available data) and Abstracts Views on Vision4Press platform.
Data correspond to usage on the plateform after 2015. The current usage metrics is available 48-96 hours after online publication and is updated daily on week days.
Initial download of the metrics may take a while.