Fig. 8
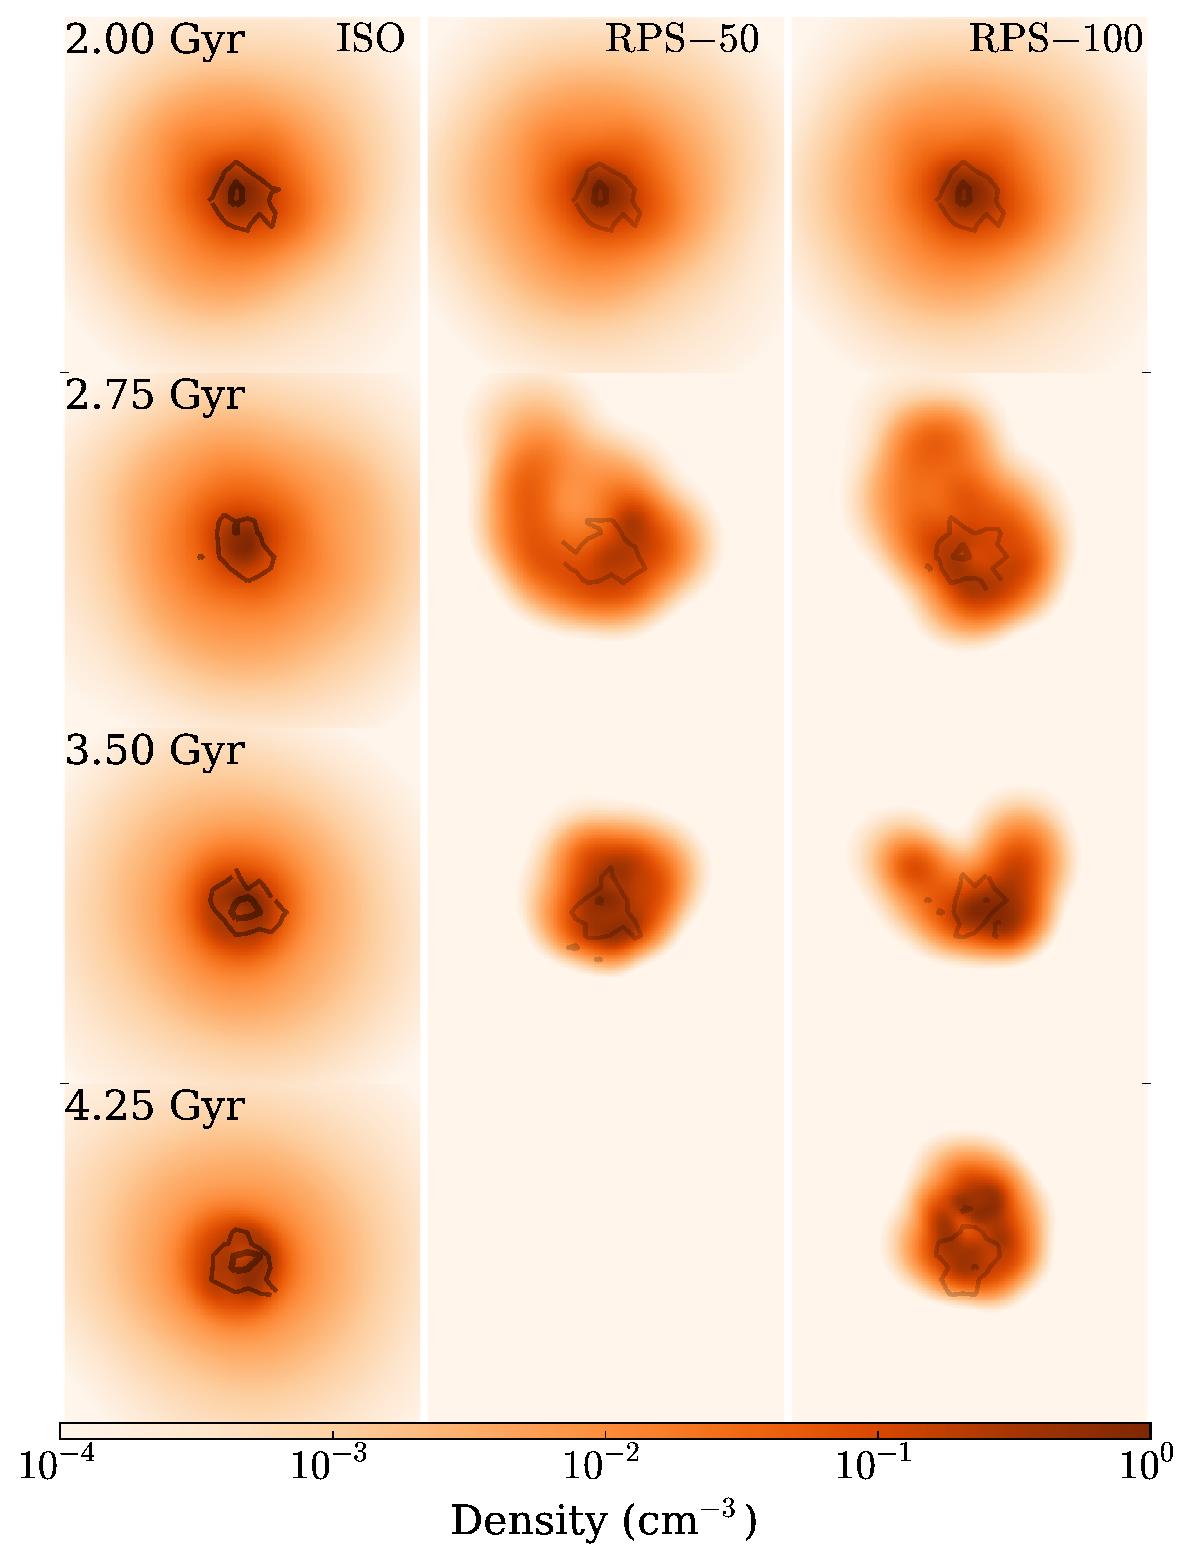
Density of gas (image) and dark matter (contours) at 750 Myr intervals for pseudo-isothermal models from infall; beginning at infall in a 0.5 kpc slice through the centre of the dwarf. Only gas below 106 K is shown. Each box is 15 kpc per side. The ISO model is shown in the left column, RPS-50 in the middle column, and RPS-100 in the right column. The gas density is listed on the colour bar and the dark matter contours (from thick to light) are 106.5, 106, and 105.5 M⊙ kpc-3.
Current usage metrics show cumulative count of Article Views (full-text article views including HTML views, PDF and ePub downloads, according to the available data) and Abstracts Views on Vision4Press platform.
Data correspond to usage on the plateform after 2015. The current usage metrics is available 48-96 hours after online publication and is updated daily on week days.
Initial download of the metrics may take a while.