Fig. 4
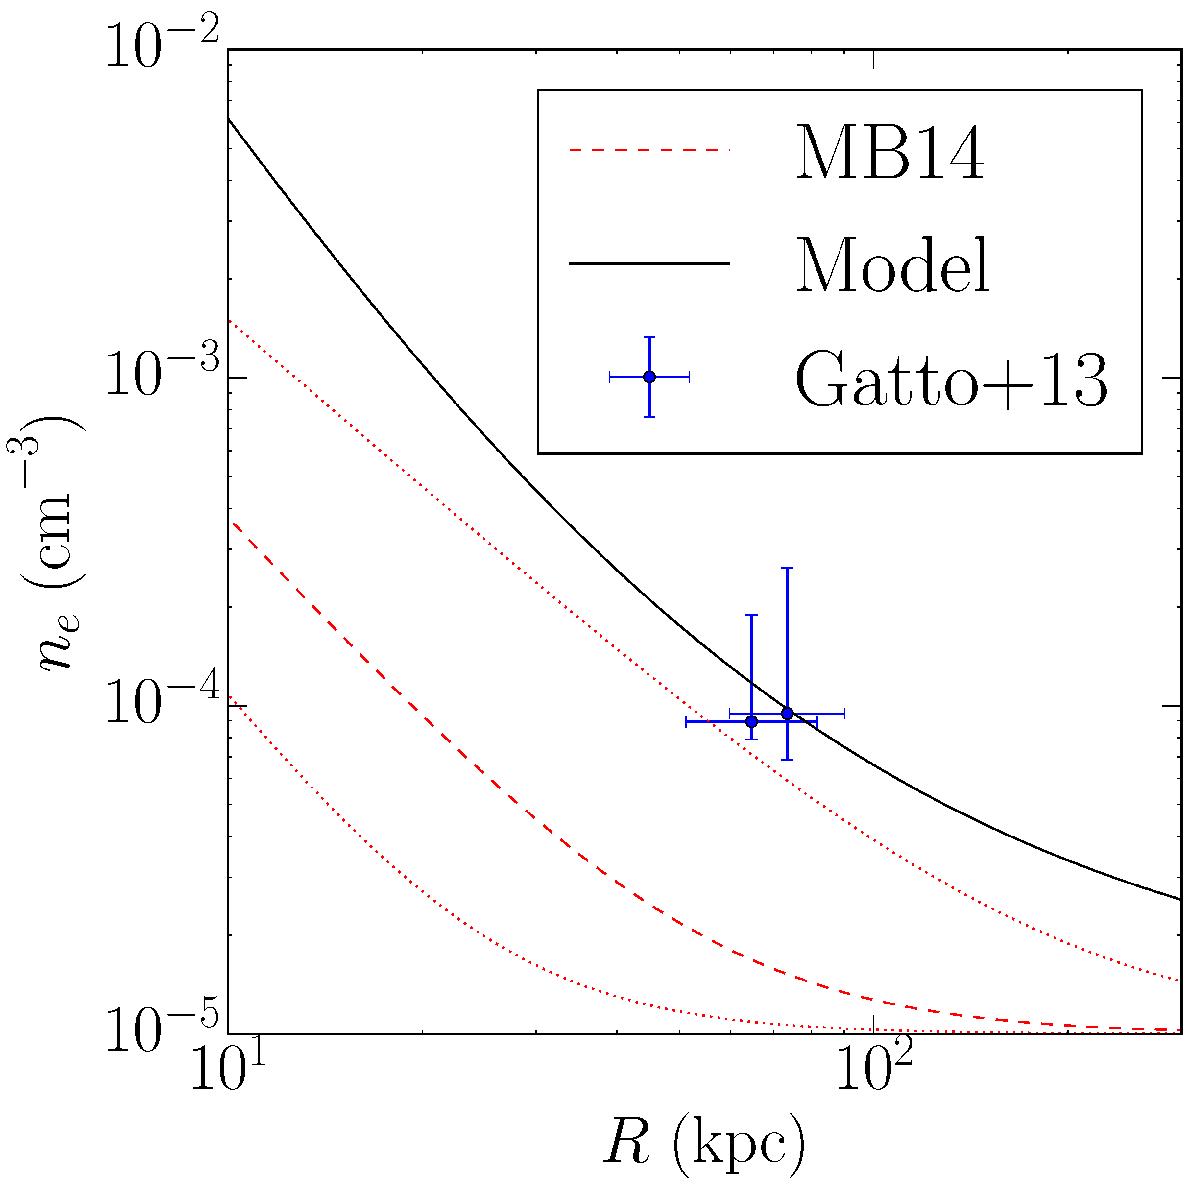
Halo density profile for our chosen model (black line). The best-fit β profile of Miller & Bregman (2013) is shown with a red dashed line, with dotted lines indicating the error in β. The density of the halo determined by the simulations of Gatto et al. (2013) for Carina and Sextans to be stripped in one passage are shown with blue points.
Current usage metrics show cumulative count of Article Views (full-text article views including HTML views, PDF and ePub downloads, according to the available data) and Abstracts Views on Vision4Press platform.
Data correspond to usage on the plateform after 2015. The current usage metrics is available 48-96 hours after online publication and is updated daily on week days.
Initial download of the metrics may take a while.