Fig. 2
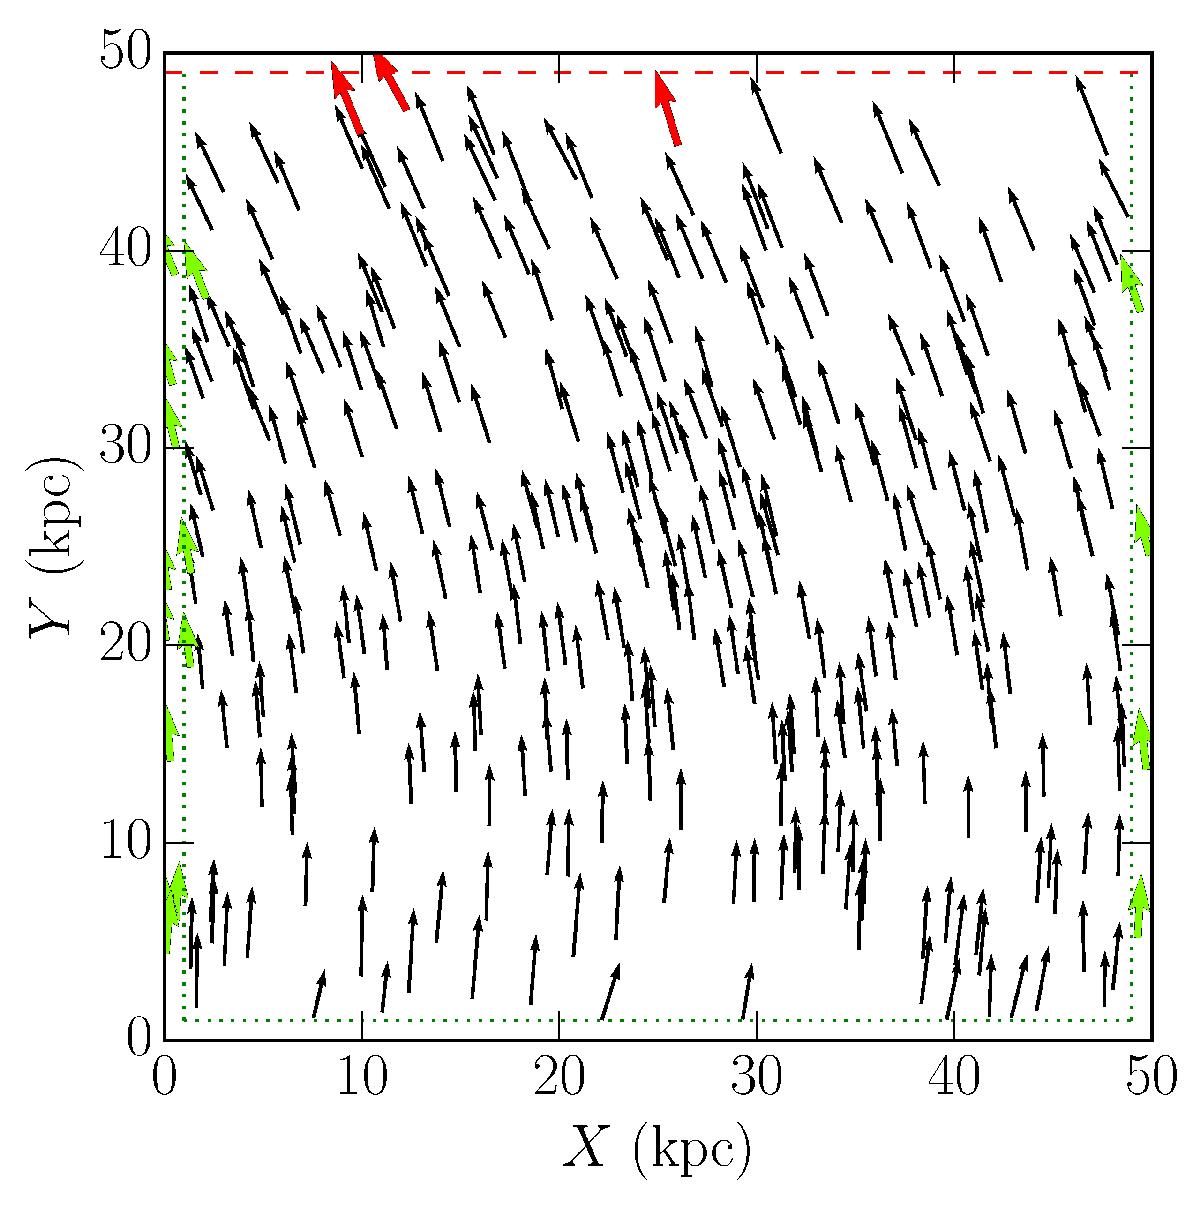
Schematic of particle deletion. Shown in a 50 × 50 kpc box. The deletion regions (exaggerated by a factor of 10 from that used) are shown with a red dashed line (for deletion of all particles) and green dotted lines (deletion of stellar/dark matter particles). Particle positions and velocities are shown with arrows. Particles that would be deleted on the next time step if they were stellar or dark matter particles are shown in green. Particles that would be deleted on the next time step regardless of their type (gas, stellar, or dark matter) are shown in red. The remaining particles, which are not deleted regardless of type, are shown in black.
Current usage metrics show cumulative count of Article Views (full-text article views including HTML views, PDF and ePub downloads, according to the available data) and Abstracts Views on Vision4Press platform.
Data correspond to usage on the plateform after 2015. The current usage metrics is available 48-96 hours after online publication and is updated daily on week days.
Initial download of the metrics may take a while.