Fig. 1
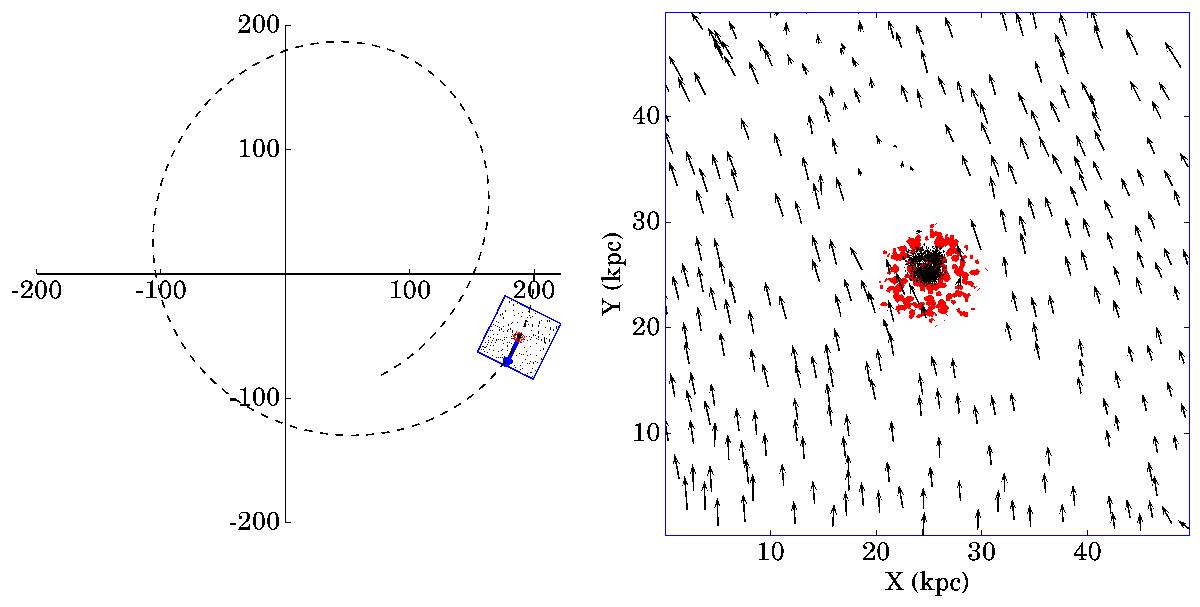
A schematic illustration of the method. This is a representation of the simulation RPS-100 described below ~400 Myr after infall. The left-hand panel shows the predicted orbit for 7 Gyr and the position of the rotating frame at the snapshot. The arrow shows the direction of the dwarf’s orbit. The right-hand panel is a quiver plot showing the position and velocity of a 0.5 kpc central slice of gas, with contours of the projected dark matter density shown in red. For conceptual ease, the velocity in an inertial frame is shown, which is related by a transformation to the rotating frame described in Eq. (2).
Current usage metrics show cumulative count of Article Views (full-text article views including HTML views, PDF and ePub downloads, according to the available data) and Abstracts Views on Vision4Press platform.
Data correspond to usage on the plateform after 2015. The current usage metrics is available 48-96 hours after online publication and is updated daily on week days.
Initial download of the metrics may take a while.