Fig. 4
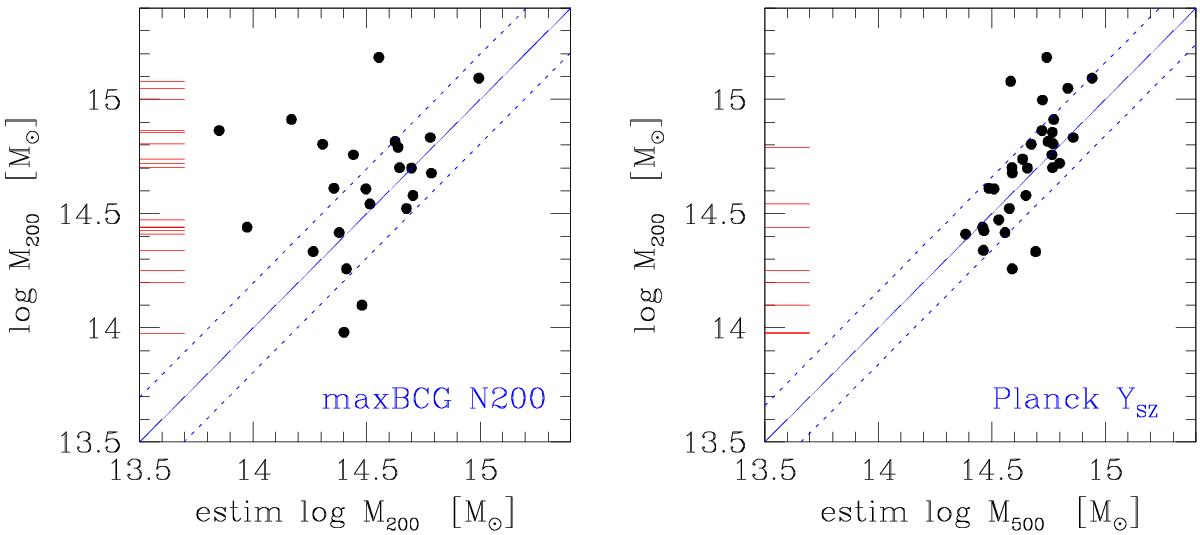
Performances of maxBCG richness (left-hand panel) and of Planck YSZ (right-hand panel) proxies. The plots compare the richness- or YSZ-predicted masses vs. the caustic mass for the very same sample used in Fig. 3. The solid line is the one-to-one relation (not a fit to the data). The dotted lines show the above line plus or minus the claimed mass precision (left-hand panel) or our richness performances (right-hand panel) for comparison with Fig. 3. The (red) ticks on the ordinate of the three panels indicates unmatched clusters.
Current usage metrics show cumulative count of Article Views (full-text article views including HTML views, PDF and ePub downloads, according to the available data) and Abstracts Views on Vision4Press platform.
Data correspond to usage on the plateform after 2015. The current usage metrics is available 48-96 hours after online publication and is updated daily on week days.
Initial download of the metrics may take a while.