Fig. 2
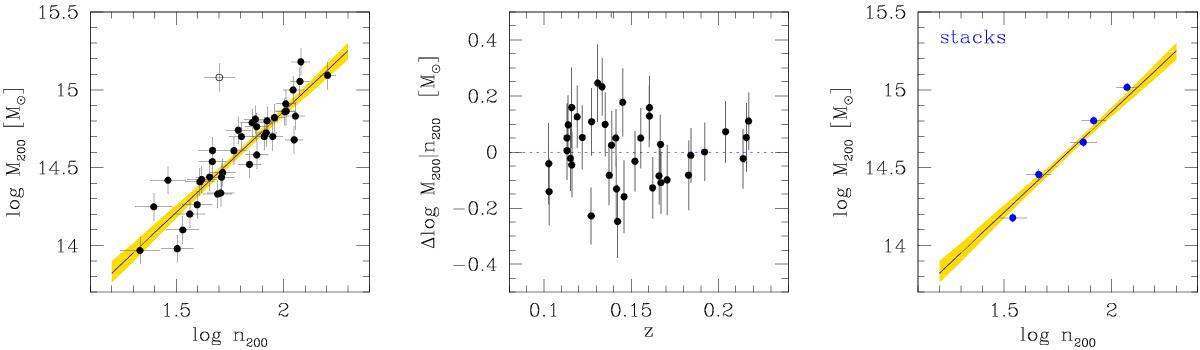
Richness-mass scaling (left-hand and right-hand panels) and residuals (observed minus expected) as a function of redshift (central panel). The solid line marks the mean regression line (of log M200 on log n200) fitted to the individual galaxy data, while the shading indicates the 68% uncertainty (highest posterior density interval). The right-hand panel combines clusters in stacks of eight clusters each, with the exception of the most massive point, composed of just six clusters. Masses are corrected for the negligible best-fit evolution. Points and approximated error bars are derived by adding errors summed in quadrature, as commonly done in the literature. The open point (Abell 1068) is not fitted and is out of scale in the central panel.
Current usage metrics show cumulative count of Article Views (full-text article views including HTML views, PDF and ePub downloads, according to the available data) and Abstracts Views on Vision4Press platform.
Data correspond to usage on the plateform after 2015. The current usage metrics is available 48-96 hours after online publication and is updated daily on week days.
Initial download of the metrics may take a while.